


Exploring SimplyMap Data: Retail Market Power
Posted on Apr 10, 2015 by Admin
In this week’s SimplyMap report, we explore one of the newer datasets available: Retail Market Power®.
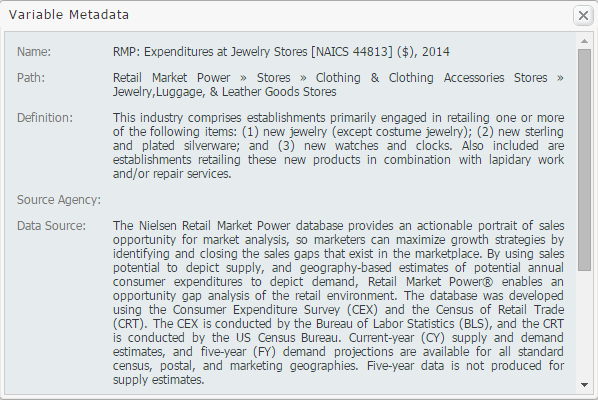
What is it? In short, the Retail Market Power® dataset helps users identify opportunities within the industry they are targeting. These gaps are identified by analyzing expenditures and retail sales. Marketers can focus on targeting areas where the expenditures far exceed the total sales.
Let’s take a look at an example.
Scenario: You are thinking of opening up a jewelry store in your ZIP code, but first you want to determine if there is a need for one, and discover if people in the area readily buy jewelery.
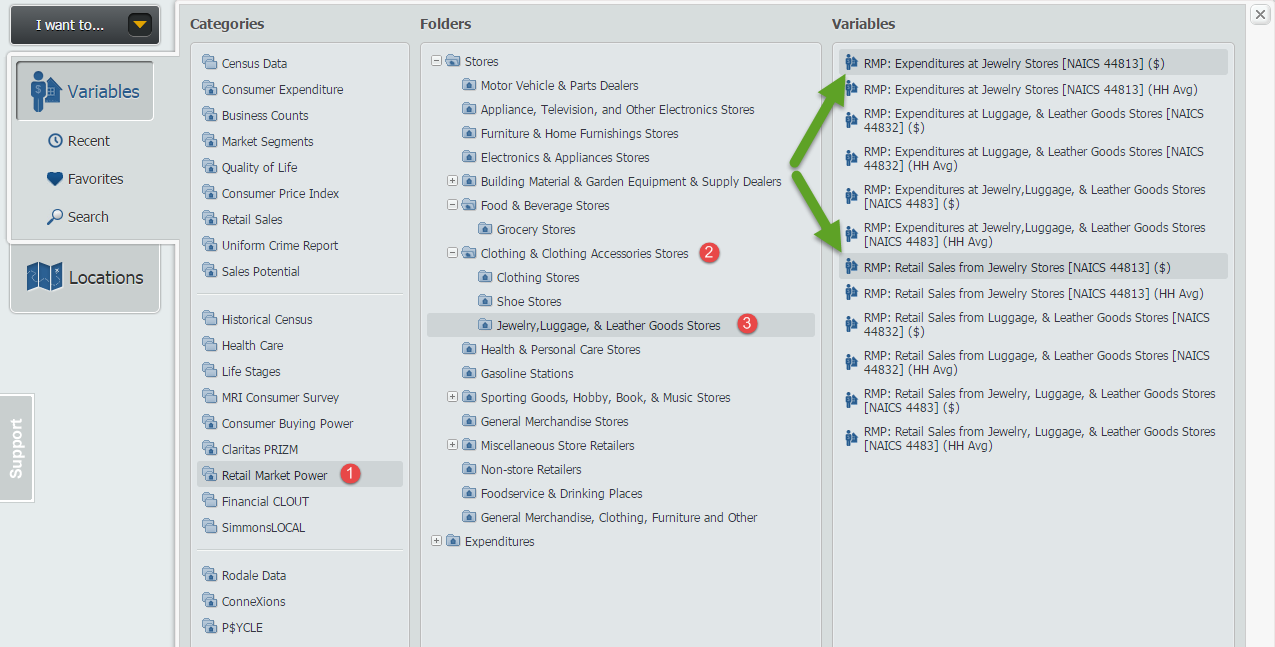
Solution: First, open a Standard Report and use your ZIP code as the location. Next, navigate through the Retail market Power category in the Variables menu to find jewelry store expenditures and sales in your location. After selecting the correct variables, close out the Variables menu to generate your report.
 The report is shown below:
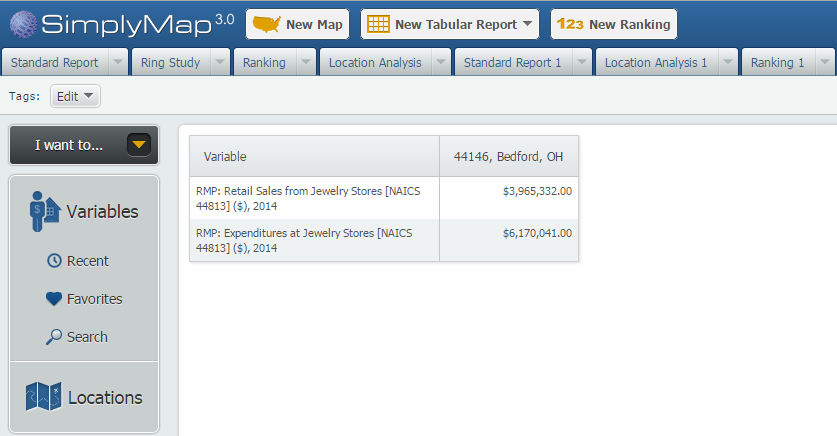
According to the above results, there is a fairly large gap in the jewelry store industry in the 44146 ZIP code where expenditures are greatly exceeding sales. Many residents must be spending their money at jewelry stores outside of the ZIP code, creating an opportunity for more jewelry stores to site locally.
The above scenario is a brief look at this dataset. Explore the other 17 category folders and let us know some interesting figures you come across!
Lastly, don’t forget to enter into our Winter Sweepstakes where we’ll be giving away an iPad and Kindle Fire! Details here: Winter Sweepstakes!
More from SimplyAnalytics
Posted on Aug 02, 2016 by Admin
Did you know that you can use SimplyMap to identify which make and model of vehicle is most prevalent within any location in the United States? In this week’s SimplyMap report, we’ll take...
Posted on Dec 07, 2011 by Admin
We will be exhibiting at the American Library Association Midwinter Meeting & Exhibition in Dallas this January. Visit us at booth 2513 for a demonstration and to have all your Simply...
Posted on Sep 10, 2010 by Admin
SimplyMap Canada is now available at several Canadian institutions, including York University and Ryerson University, in Toronto. SimplyMap Canada has all of the great features included i...
Posted on Apr 10, 2015 by Admin
In this week’s SimplyMap report, we explore one of the newer datasets available: Retail Market Power®. What is it? In short, the Retail Market Power® dataset helps users identify opportun...
Posted on Nov 19, 2019 by Admin
Hello readers! Today we are bringing you a new blog entry inspired by a recent Help Desk question. If you ever have any questions about SimplyAnalytics, please do not hesitate to reach ou...
Posted on Dec 02, 2019 by Admin
Hi everybody! We’re back this week with another question from our Help Desk. This time featuring SimplyAnalytics Canada. Let’s get started! Question: How can I analyze all of the PRIZM5 s...
Posted on Mar 30, 2016 by Admin
In previous blog entries we highlighted the usefulness of viewing multiple years of data for the same variable. In short, analyzing the same variable across multiple years allows users to...
Posted on Jun 09, 2016 by Admin
In this week’s blog, we’ll be featuring our newest data offering, PRIZM® Premier. If your institution currently subscribes to PRIZM data, this new module is available at no additional cos...
Posted on Nov 06, 2019 by Admin
Hello readers! We hope you’re having a wonderful week. Today we feature another entry from our From the Help Desk series. Let’s get started! Question: How do I analyze data for downtown? ...
Posted on Mar 14, 2010 by Admin
The GRI team was honored to learn that SimplyMap was included in this year's Choice Outstanding Academic Title List, published in the January 2010 issue of Choice Magazine. This is a grea...