


From the Help Desk: How do I analyze data for downtown?
Posted on Nov 06, 2019 by Admin
Hello readers! We hope you’re having a wonderful week. Today we feature another entry from our From the Help Desk series. Let’s get started!
Question: How do I analyze data for downtown?
Answer: Use the combination location feature. The combination location feature enables users to combine locations of similar geographies to form one larger area. SimplyAnalytics will calculate all number, percent, and average data variables for the custom area. Here’s how to do that.
- Click on the Locations button (1), and select the Custom Locations heading (2). From there, select Create New Combination Location (3). Enter the name for your location in box 1 (4).
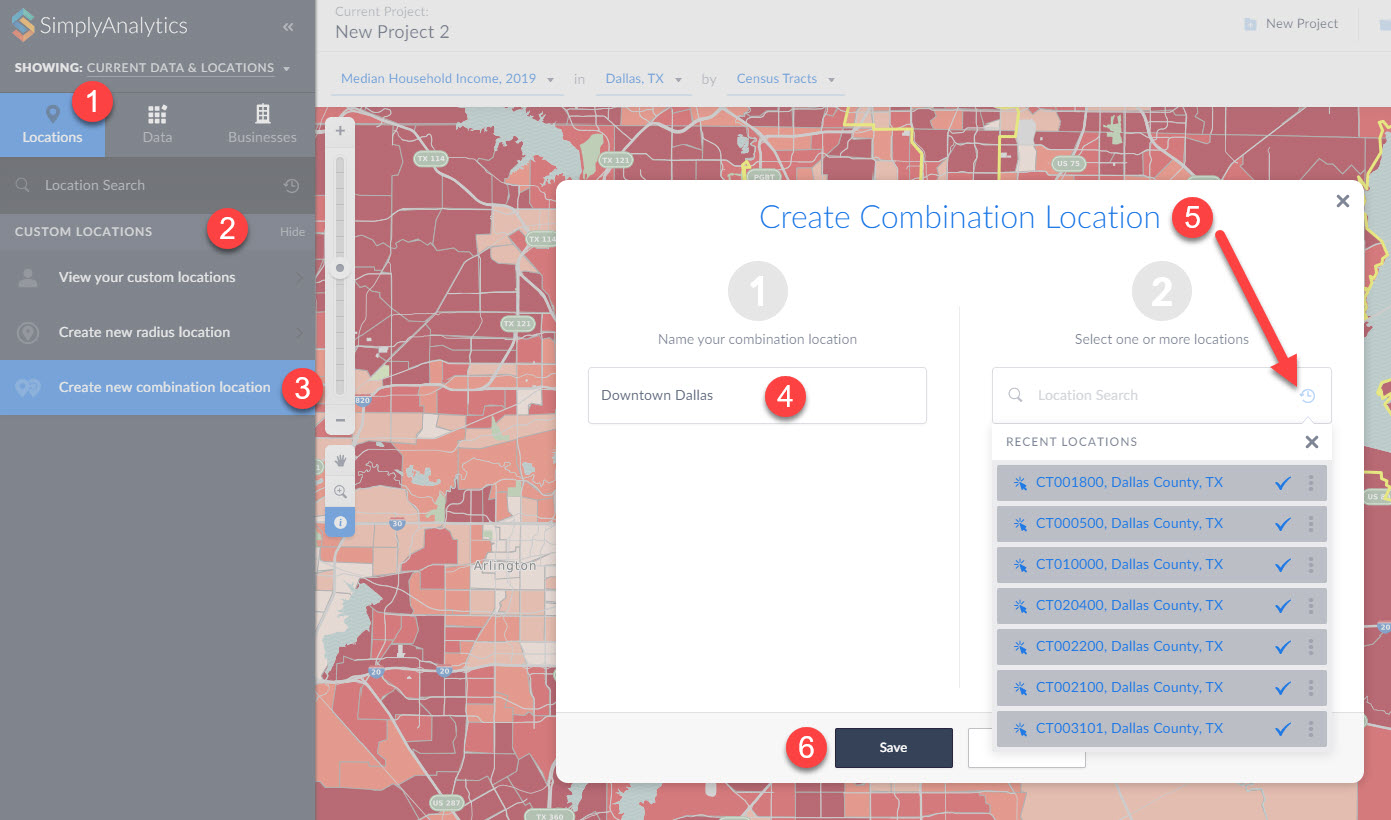
(5) If you have a list of locations that make up your custom location, you can enter them into box number 2. Alternatively, if you have previously used or favorited locations, you can easily access them by clicking on the respective icons within the Locations option as shown in step 5 above. (6) Click Save.
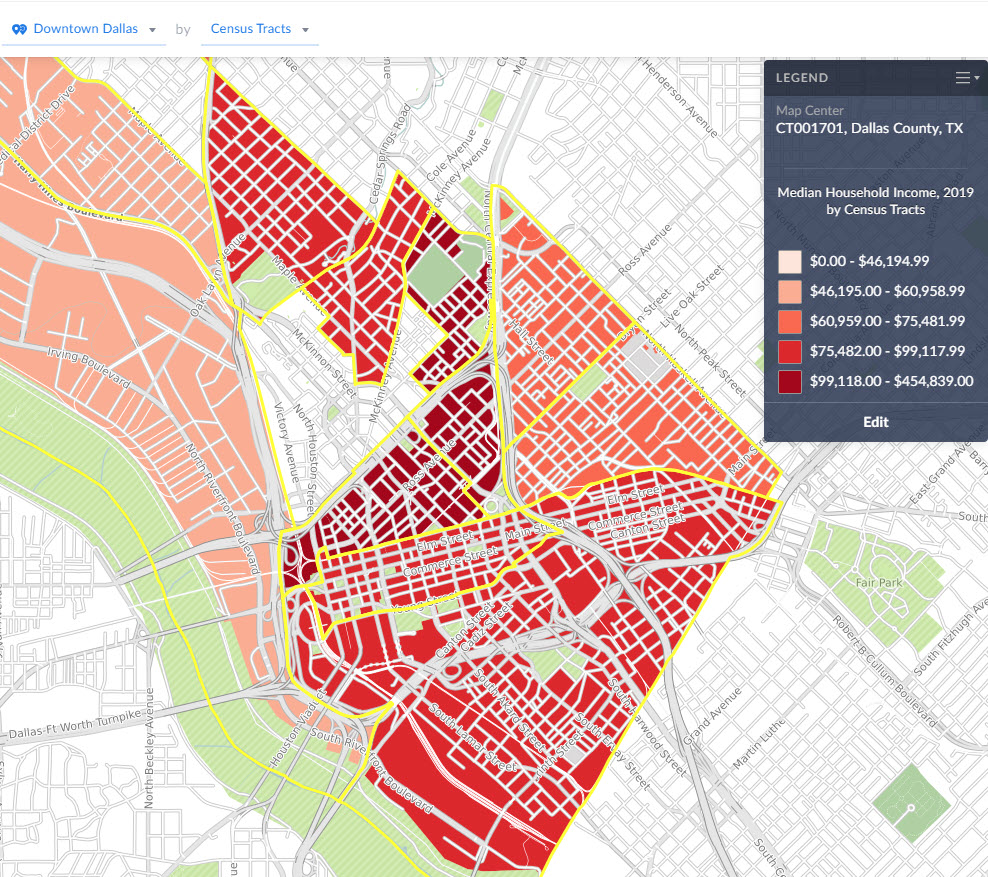
Your new location gets created and can now be mapped or used with any of the available reports in SimplyAnalytics:
That’s all we have for today - stay tuned for more!
More from SimplyAnalytics
Posted on Feb 02, 2024 by Admin
We are excited to be back exhibiting at PLA this April in Columbus, OH. Join us at Booth #2631 to discover how SimplyAnalytics can help libraries understand their service area, assist sma...
Posted on Feb 25, 2020 by Admin
SimplyAnalytics will be exhibiting at the PLA Conference, held this year at the Music City Center in Nashville, TN on February 26 - 28. Visit the team at Booth 1444 with your questions, f...
Posted on Sep 20, 2011 by Admin
Men's Health magazine has once again published rankings that include research from SimplyMap. They ranked the most (and least) educated cities in America. In addition to several other sou...
Posted on Mar 21, 2011 by Admin
Men's Health magazine decided to crown one town America's Most Socially Networked City, and has generated quite a buzz in the process. Their survey examined the number of Facebook and Li...
Posted on Apr 30, 2008 by Admin
Doreen Harwood, Business Librarian from the University of Washington has developed a series of detailed tutorials on using SimplyMap. The tutorials, which are Flash-based and interactive,...
Posted on Jun 02, 2016 by Admin
Three weeks ago we utilized the SimmonsLOCAL data set to visualize contiguous America’s mayonnaise brand preference. Staying with the American visualization theme, this week’s report will...
Posted on Jan 23, 2015 by Admin
SimplyMap offers a total of 5 unique types of reports: Standard Report, Ranking Report, Business Report, Ring Study, and Location Analysis. This brief write up will define what each repor...
Posted on Feb 27, 2015 by Admin
SimplyMap is an excellent tool for market research, and it’s made even more powerful by Nielsen PRIZM data. Nielsen PRIZM is the highest quality market segment data available. Every house...
Posted on Jul 19, 2016 by Admin
Are you a tech wizard? Maybe you’re an apprentice? Learn more about technology consumption behaviors using the Simmons MOSAIC Technology Adoption segments located within the SimmonsLOCAL ...
Posted on May 19, 2015 by Admin
We will be attending ALA this summer in San Francisco (hint: dress warm!). Visit us at Booth 413 and don't forget to enter our raffle - we will be giving away a $100 gift certificate to A...