 Go up
Go up


York and Ryerson Universities Subscribe to SimplyMap Canada
Posted on Sep 10, 2010 by Admin
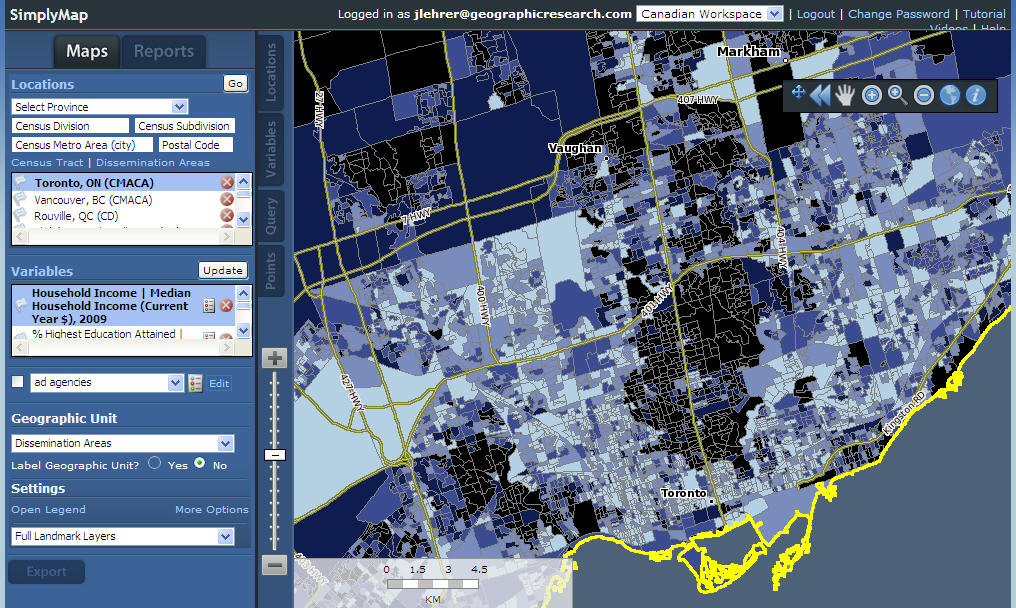
SimplyMap Canada is now available at several Canadian institutions, including York University and Ryerson University, in Toronto.
SimplyMap Canada has all of the great features included in the US version, and Canada-specific data sets from Environics Analytics Group that include Adjusted Census Data from the year 2006, Current Estimates and Five Year Projections & the Current Estimates Household Expenditure Potential (HEP). It also includes the D&B Canadian Business Directory, with over 1.1 million Canadian business points. All data is available nationwide for all Canadian geographies including Provinces, census divisions, census subdivisions, census metropolitan areas, census tracts and dissemination areas.
There is a demo of SimplyMap scheduled for September 15th, at York University. Learn more.
Read more on MADAR - Maps and Data at Ryerson
More from SimplyAnalytics


Posted on Jan 24, 2009 by Admin
Men's Health magazine took a look this month at where our wireless habits are most out of control. Their methodology includes the use of SimplyMap: First, we crunched data from SimplyMap...
Posted on May 23, 2012 by Admin
We will be exhibiting at the Special Libraries Association (SLA) annual conference and Info-Expo at McCormick Place in Chicago Sunday June 15th - Tuesday July 17th. Visit us at Booth 124 ...
Posted on Jun 02, 2017 by Admin
We can't wait for ALA Annual this Summer, and the opportunity to share SimplyAnalytics with the ALA community. Stop by the SimplyAnalytics booth (1339) and take a peak at what we've been ...
Posted on Jul 30, 2018 by Admin
Hello readers! Welcome to this week’s blog. This week we will feature the Related Data Table view and how you can use it to maximize your productivity in SimplyAnalytics. What is it? The ...
Posted on Feb 01, 2009 by Admin
Want to know the top 10 wealthiest ZIP codes in your state? How about the top 25 counties with the most elderly residents? Duke University students can now easily answer these questions a...
Posted on Apr 30, 2008 by Admin
Doreen Harwood, Business Librarian from the University of Washington has developed a series of detailed tutorials on using SimplyMap. The tutorials, which are Flash-based and interactive,...
Posted on Mar 11, 2024 by Admin
We're thrilled to announce that SimplyAnalytics will be exhibiting at the ALA Annual Conference in San Diego! We can't wait to connect with library professionals, share insights, and show...
Posted on Oct 02, 2015 by Admin
In this week’s SimplyMap tip, we wanted to do a quick write up reminding users about the Saved Tabs feature within SimplyMap. Did you know that SimplyMap will automatically save all of yo...
Posted on Nov 28, 2023 by Admin
Hello readers! We are happy to announce that SimplyAnalytics has successfully migrated to the Census 2020 boundaries on Sunday, November 19th. This blog will talk about what that is, what...
Posted on Apr 28, 2016 by Admin
In this week’s SimplyMap report we’ll take a look at one of our newer data packages offered, P$YCLE® by Nielsen. P$YCLE® is a segmentation system that evaluates consumers using key demogr...