


From the Help Desk: How to Analyze all PRIZM Segments at Once
Posted on Dec 02, 2019 by Admin
Hi everybody! We’re back this week with another question from our Help Desk. This time featuring SimplyAnalytics Canada. Let’s get started!
Question: How can I analyze all of the PRIZM5 segments for my target area so I can identify the most common segment?
Note: For those unfamiliar with the PRIZM data, this dataset is a marketing segmentation system where households are grouped into one of 68 unique segments based on: demographics, lifestyles, consumer behaviour and settlement patterns in Canada. These segments help you understand what customers are buying, doing and thinking. This is ideal for target marketing, trade area analysis, merchandising and media planning.
Please give us an email if you would like a free trial to the PRIZM data - it is available for both SimplyAnalytics USA and SimplyAnalytics Canada.
Answer: The quickest and easiest way to analyze many similar variables at once is to utilize the Related Data Table. The Related Data Table automatically adds in any similar variables to your chosen one. In this example, we’ll add one PRIZM segment, and the report will add all of them in. This can be used with any variable or dataset - give it a try!
Here’s how:
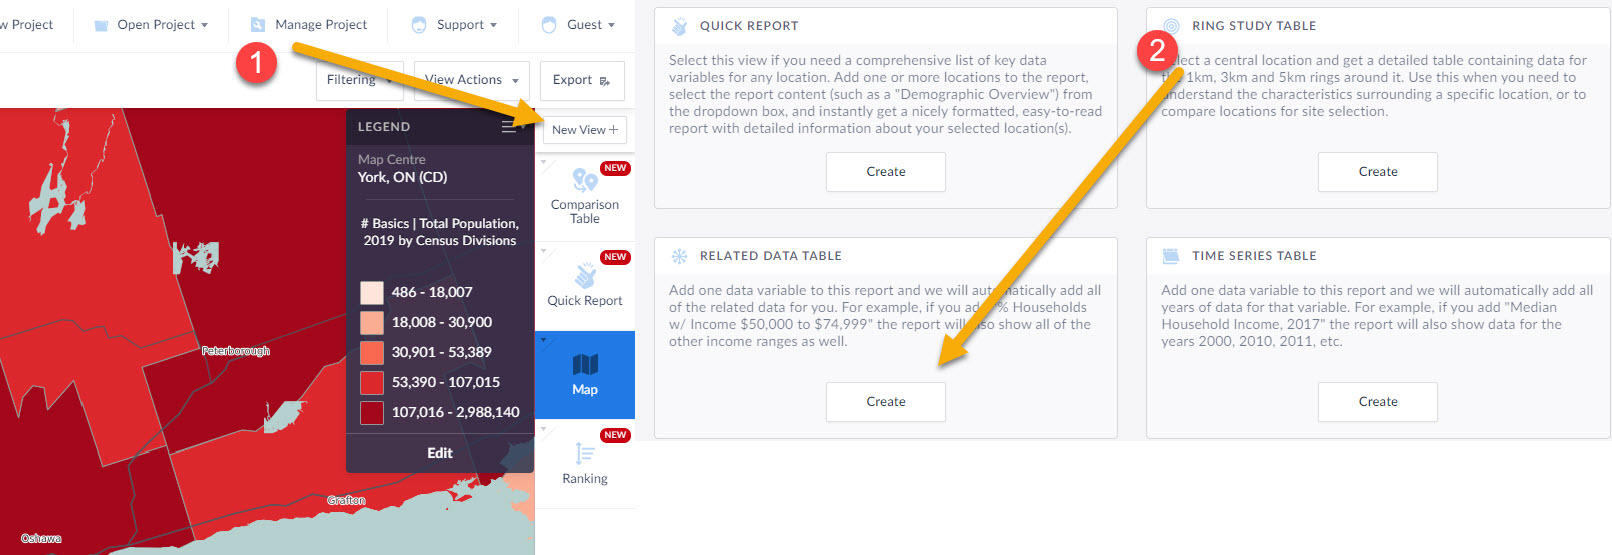
1.) Click on New View towards the top right, then create under Related Data Table
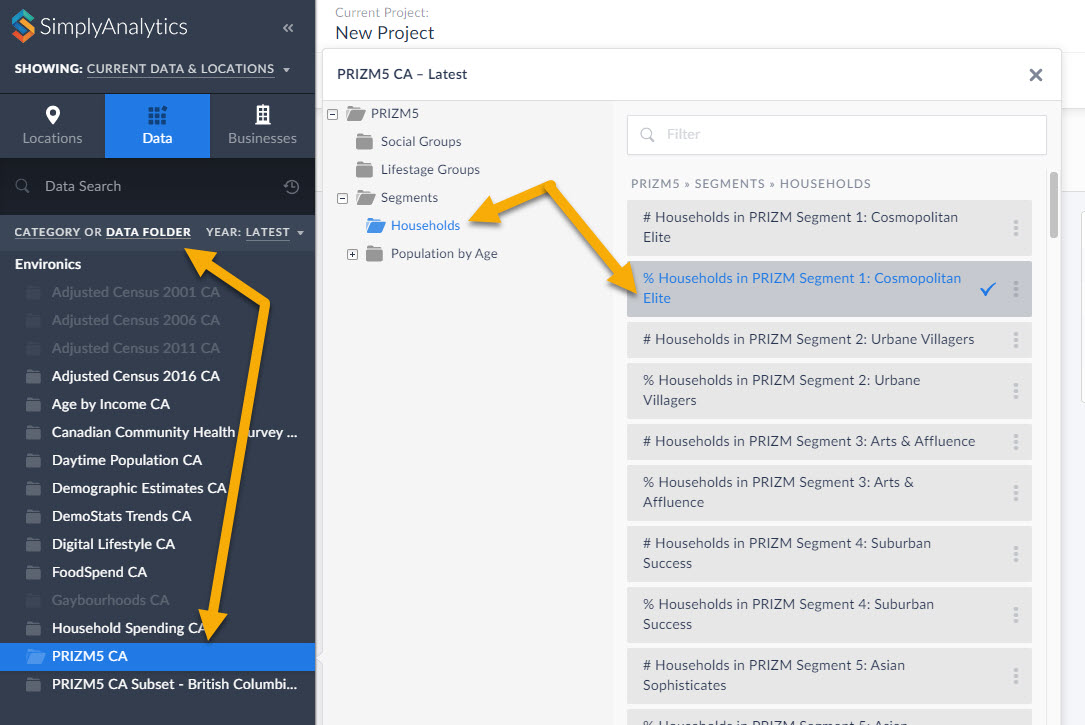
2.) Within the Data block, select any of the PRIZM segments, close the panel, and click on Done.
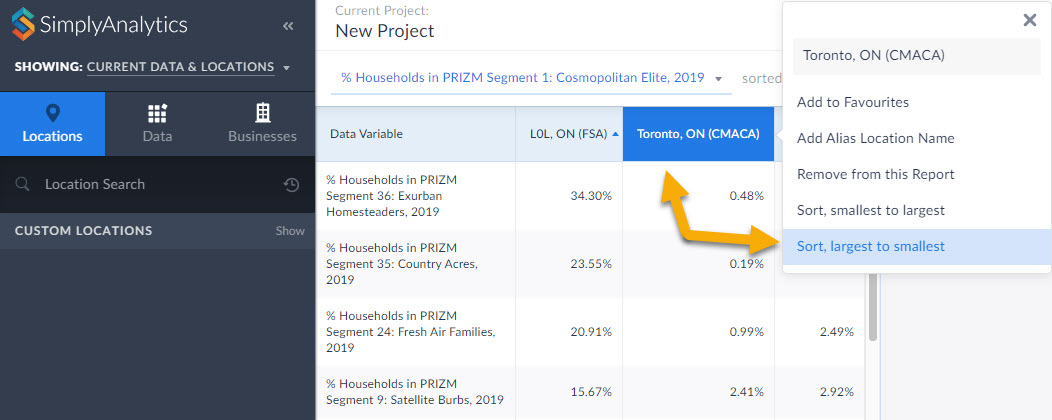
3.) The report will automatically add all PRIZM segments in the category you selected (households, in this case). Click on your location and Sort Descending to view the top segments in the given area. This is a powerful tool for users who want to market a product to a specific segment.
BONUS TIP: Within the Data Documentation page in the Support dropdown (top-right) users have access to the 2019 PRIZM Marketer's Handbook. Check out the super helpful Quick Reference PRIZM Guides on page 212 and 234. This is a great starting point for marketers to determine which PRIZM segments they want to focus on depending on age, children, urbancity, income, etc. For example, if you want high income suburban young families, you'd want Pets & PCs. You can favorite that PRIZM Segment, and use it in a Ranking Report to find out where all the Pets and PCs folks live in your requested geography.
That’s it for this week’s blog! Stay tuned for more.
More from SimplyAnalytics
Posted on Oct 23, 2009 by Admin
SimplyMap was highlighted in the Wake County, NC Public Library Business Blog today as a valuable tool for business planning. Wake County has access to SimplyMap through NC LIVE, a statew...
Posted on Apr 05, 2019 by Admin
Come visit the SimplyAnalytics booth (325) at the upcoming ACRL 2019 show in Cleveland! Say hello, grab a chocolate, and stay for a quick demo of SimplyAnalytics. The team will be showcas...
Posted on Jul 26, 2016 by Admin
In this week’s SimplyMap report, we’ll take a look at the Retail Market Power dataset and provide a simple, effective example of how the data package can be used. If your institution curr...
Posted on Nov 23, 2012 by Admin
Men's Health magazine is charting vanity in US cities, with help from SimplyMap. What did they find? The Sunshine State, with a long history of going to great lengths to look good, tops t...
Posted on May 08, 2018 by Admin
This summer's ALA conference is in New Orleans and the SimplyAnalytics team will be exhibiting at booth #837. We hope you stop by to learn about new features, check out our new data offer...
Posted on Feb 27, 2009 by Admin
Geographic Research, Inc. is pleased to participate in the Statewide California Electronic Library Consortium's (SCELC) 12th Annual Vendor Day. SCELC members and librarians from other aca...
Posted on May 16, 2022 by Admin
Hello readers! We hope you are having a wonderful day. Today we feature a question from the help desk that we think many users would find useful. Let’s get started. The question: How can ...
Posted on Oct 12, 2010 by Admin
NC LIVE, a member-driven library service organization dedicated to providing online information services that support education, enhance statewide economic development, and increase qu...
Posted on Jul 30, 2015 by Admin
One great feature within SimplyMap is the ability to track the same variable across multiple years. In this report, we will track the percentage of households in the US ordering items fro...
Posted on Sep 07, 2011 by Admin
Geographic Research will be exhibiting and presenting during a vendor showcase session at the upcoming North Carolina Library Association (NCLA) Biennial Conference, October 4-7, 2011 in ...