


The Landline Telephone’s Descent
Posted on Mar 30, 2016 by Admin
In previous blog entries we highlighted the usefulness of viewing multiple years of data for the same variable. In short, analyzing the same variable across multiple years allows users to identify trends. For example, in one of the previous blogs we showcased the explosion of tablet ownership over recent years (quadrupling!).For this week’s blog, we’ll see if the data matches our own observations on the rapid decline of landline phones in households. Let’s get started!
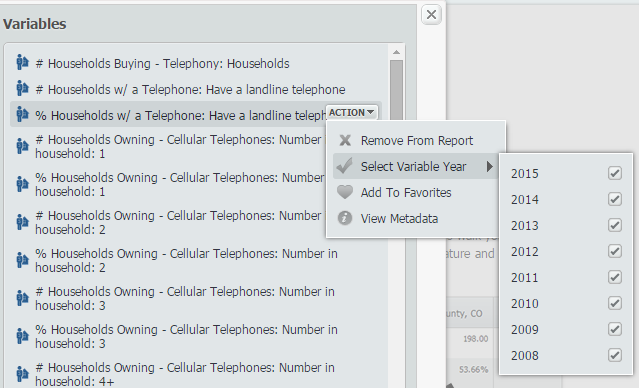
First, open a Standard Report and navigate through this path: MRI Consumer Survey » Telephone to find the variable, % Households w/ a Telephone: Have a landline telephone, 2015.
Hover over the variable and select the Select Variable Year option from the Action Dropdown menu. You will see the years 2008-2015 on your screen. Select each year as shown below:
Close out the variables panel to generate your report for the United States. Here are the results:
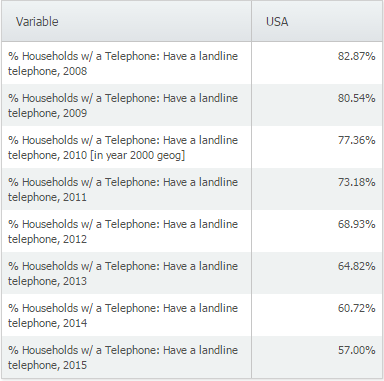
The percentage of households with a landline telephone has dropped significantly, from 82.87% in 2008 to 57% in 2015. We suspect this decrease is due in part to the rise in cell phones among other things, but we’ll leave that data to another blog.
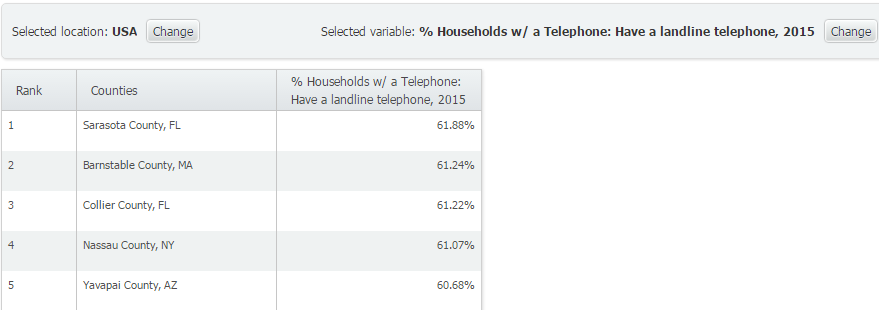
Out of curiosity, we ran a Ranking Report to determine the top 5 counties in America with the highest % of households having a landline telephone:
Note: We applied a population filter of > 200,000.
We hope you enjoyed this week’s SimplyMap report - stay tuned for more!
More from SimplyAnalytics
Posted on Jun 02, 2017 by Admin
We will be exhibiting at SLA in Phoenix, AZ on June 18th-20th. You can find the SimplyAnalytics team at Booth #905. Stop by and check out our groundbreaking new interface, have a chocolat...
Posted on Dec 19, 2016 by Admin
Stop by the Geographic Research booth [#T8] at the Ontario Library Association Super Conference to get a hands-on look at our latest and greatest SimplyMap offering. The conference will t...
Posted on Jul 26, 2016 by Admin
In this week’s SimplyMap report, we’ll take a look at the Retail Market Power dataset and provide a simple, effective example of how the data package can be used. If your institution curr...
Posted on Dec 08, 2017 by Admin
Good afternoon, readers! This week we’re going to talk about project management in SimplyAnalytics and how to best take advantage of it. Why are projects needed? Many users have multiple...
Posted on Jan 24, 2009 by Admin
Men's Health magazine took a look this month at where our wireless habits are most out of control. Their methodology includes the use of SimplyMap: First, we crunched data from SimplyMap...
Posted on Jan 08, 2018 by Admin
The SimplyAnalytics team will be exhibiting at ALA Midwinter in Denver February 9-12. Stop by booth 2152 for a visit and a tour of SimplyAnalytics, the best-in-class analytics and data vi...
Posted on Feb 23, 2012 by Admin
Geographic Research, Inc. will be exhibiting at the Public Library Association (PLA) Conference. Visit us at Booth 2329 to learn more about SimplyMap and enter our raffle for a new com...
Posted on Dec 02, 2014 by Admin
Today we take a look at one of the more advanced features in SimplyMap - editing the map legend. Editing the map legend is a great way to not only customize how the data is distributed on...
Posted on Apr 21, 2015 by Admin
In this week’s edition of exploring SimplyMap data, we spotlight the Consumer Buying Power® data package in SimplyMap. What is it? The Nielsen Consumer Buying Power® database incorporates...
Posted on Sep 10, 2019 by Admin
Hello readers! It’s been a minute since our last tutorial post, but you can expect to see more content on a weekly basis moving forward. “From the Help Desk” is a new feature on the blog ...