


Using SimplyMap to Identify Relationships Between Variables
Posted on Nov 11, 2015 by Admin
Inspired by a recent help desk ticket, we wanted to discuss how users may utilize SimplyMap to identify relationships between unique variables. For example, does having a college degree significantly impact the median income of areas? And how does median income effect spending on eating out? Let’s take a look at ZIP Codes within the state of North Carolina.
To quickly analyze a larger area by its smaller geographies, a Location Analysis Report is ideal.
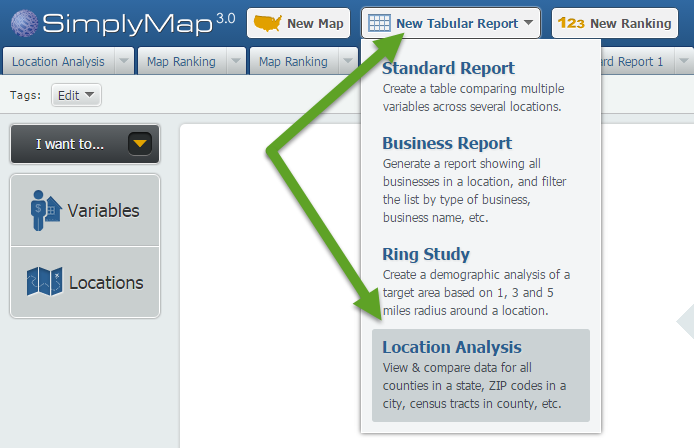
Click on New Tabular Report > Location Analysis:
Choose the state of North Carolina, and navigate to the variables you would like to see compared and analyzed. In this example, we’ll use:
Household Inc, Median
% Education, College, Master's or Doctorate Degree, 2015
% Education, High School
Food away from home (Household Average)
# Households (HHs)
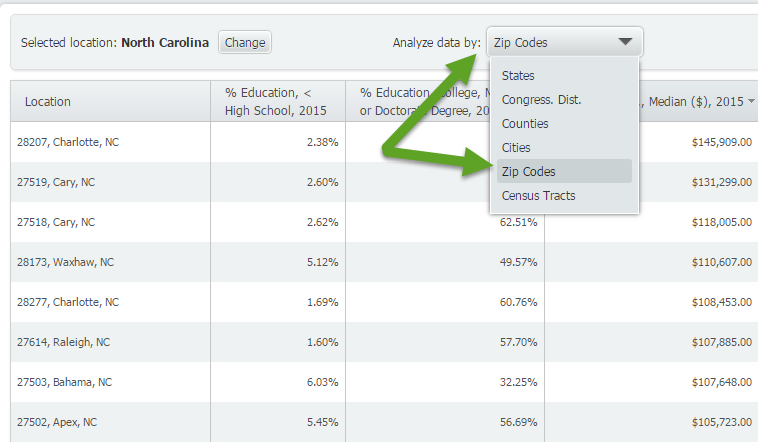
Once you’ve selected your variables, close out the Variables Panel and your report will be created. Be sure to select ZIP Codes from the Analyze Data By option that appears towards the top, shown below.
The last step is to choose a variable (column header) and Sort Descending. For example, if you sort descending for Median HH Income, you will get a ranked list (from high to low) of income by Zip Code. Scan the other columns to get a sense of education levels in these locations, and how much they tend to spend eating out.
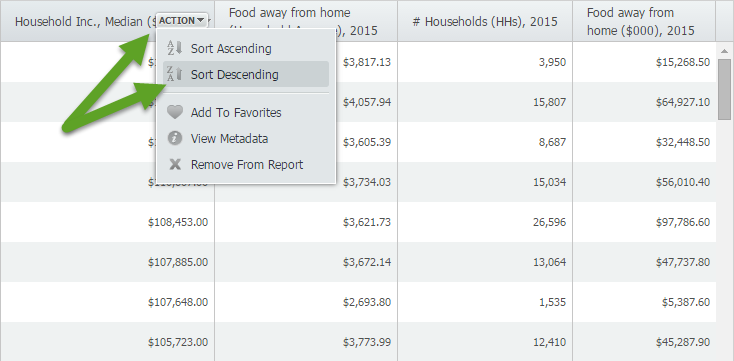
Sort Descending Income Results:
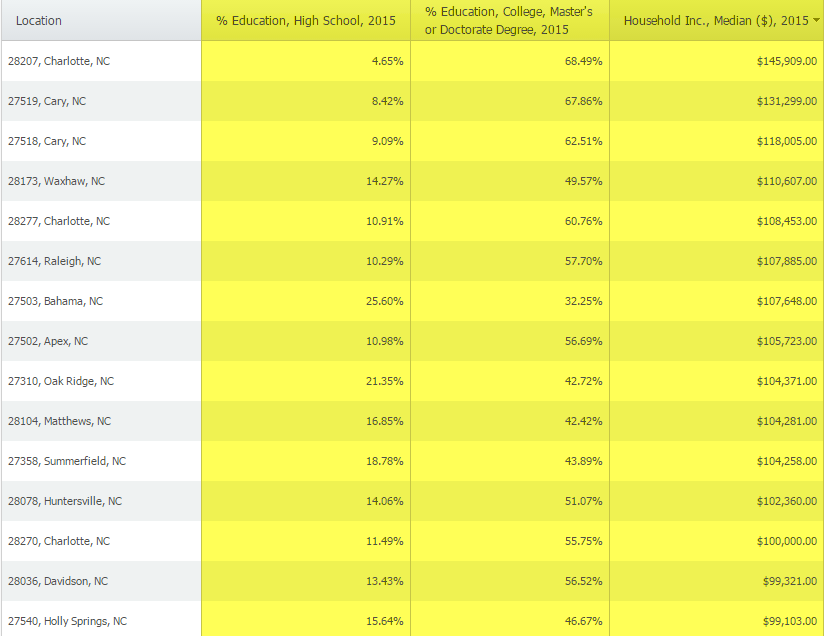
Conclusion: The results yield that higher median income areas tends to also have a higher percentage of residents who have at least a college degree. The money spent eating out was somewhat surprising as results did not vary significantly in lower median income areas (although it did go down and especially in the very low income areas).
Note: You may also want to look at # Households or Population Totals in these areas as the averages and percentages would be impacted by those figures.
These results seem to verify a relationship that’s already well known and somewhat intuitive, however, with more than 60,000 variables in SimplyMap you could study relationships between Median Income and Whiskey Drinking, or Pet Ownership, or Yoga Participation, Transportation to work... the possibilities are endless. We’ll be sure to revisit this same topic in the near future!
More from SimplyAnalytics
Posted on Jan 23, 2015 by Admin
SimplyMap offers a total of 5 unique types of reports: Standard Report, Ranking Report, Business Report, Ring Study, and Location Analysis. This brief write up will define what each repor...
Posted on Jan 16, 2026 by Admin
We are excited to be exhibiting at the Public Library Association (PLA) 2026 Conference in Minneapolis this April 1-3!
Posted on Mar 04, 2014 by Admin
March 11-15 Indianapolis, Indiana The Public Library Association is prepared for another week of events, workshops and special appearances for librarians and authors. Visit our exh...
Posted on Sep 15, 2025 by Admin
SimplyAnalytics will be attending the upcoming NCLA Conference in Winston-Salem October 14-17!
Posted on May 31, 2011 by Admin
Kenneth Johnson of the Science, Industry, and Business Library at the New York Public Library recently provided a "boot camp" on the library's market research resources to budding entrep...
Posted on Dec 02, 2019 by Admin
Hi everybody! We’re back this week with another question from our Help Desk. This time featuring SimplyAnalytics Canada. Let’s get started! Question: How can I analyze all of the PRIZM5 s...
Posted on Mar 10, 2011 by Admin
The GRI team is looking forward to exhibiting at ACRL 2011 at the PA Convention Center in Philadelphia, March 30 - April 1, 2011. Every other year, ACRL offers its premier professional d...
Posted on Sep 27, 2019 by Admin
Hello readers! This week we provide an in-depth response to a question asking about the legend classification methods in SimplyAnalytics. This response is now part of our Help Center: htt...
Posted on Jun 02, 2016 by Admin
Three weeks ago we utilized the SimmonsLOCAL data set to visualize contiguous America’s mayonnaise brand preference. Staying with the American visualization theme, this week’s report will...
Posted on Jan 23, 2024 by Admin
We are excited to again make the trip to Los Angeles for SCELCapalooza 2024 hosted at Loyola Marymount University! Please drop by our table on Wednesday, Feb. 28th to learn more about Sim...