


SimplyMap Tip - Choosing the Correct Report
Posted on Jan 23, 2015 by Admin
SimplyMap offers a total of 5 unique types of reports: Standard Report, Ranking Report, Business Report, Ring Study, and Location Analysis. This brief write up will define what each report does, and provide a real-world example of each.
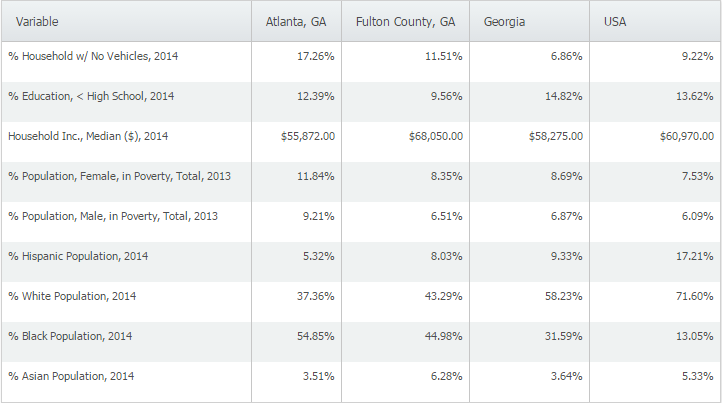
Standard Report definition - a table comparing multiple variables across several locations/location types.
Standard Report real-world use - you are applying for a grant for your city, and would like to analyze some socioeconomic variables to compare your city against the county, state, and United States.
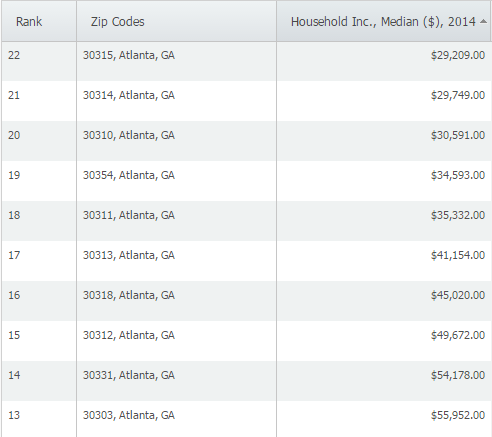
Ranking Report definition - a table ranking up to 250 locations within a single geography (ex. zipcodes within a city) and single data variable.
Ranking Report real-world use - you are looking for a target area to open up a social program for low income areas and want to rank ZIP Codes in Atlanta, GA from lowest median income up.
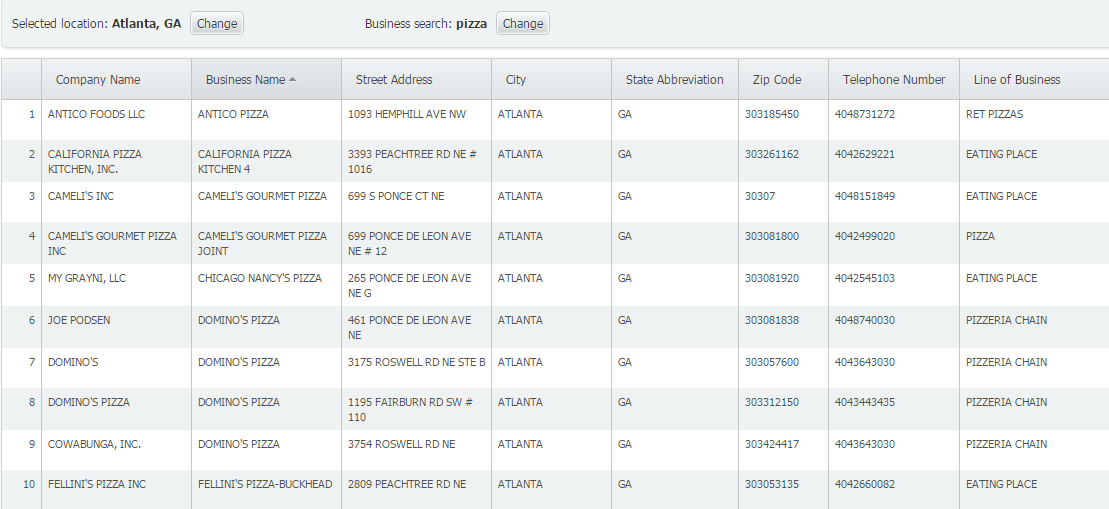
Business Report definition - generates a report showing all businesses that meet your search criteria within a given location.
Business Report real-world use - you are thinking of opening up a pizza restaurant in a city, so you want to see a list of how many pizza restaurants already exist close to your desired location.
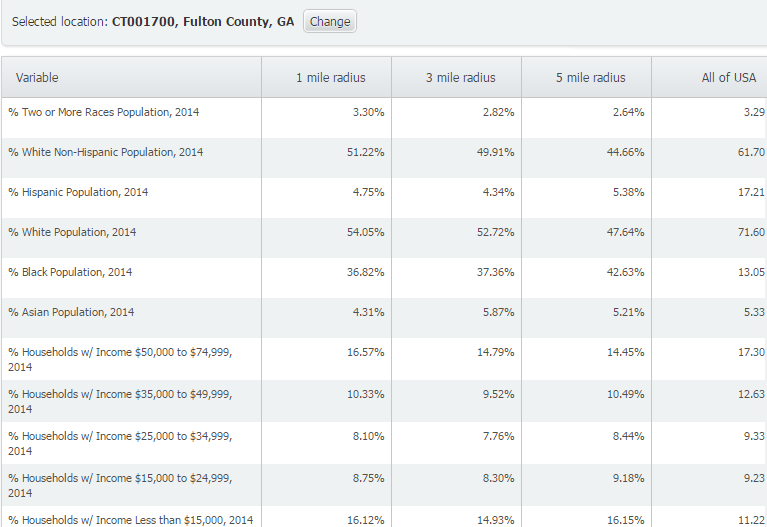
Ring Study definition - a demographic analysis of a target area based on a 1, 3, or 5 mile (or kilometer) radius around a location.
Ring Study real-world use - use to compare different variables in the immediate area, within a specified radius around the selected location.
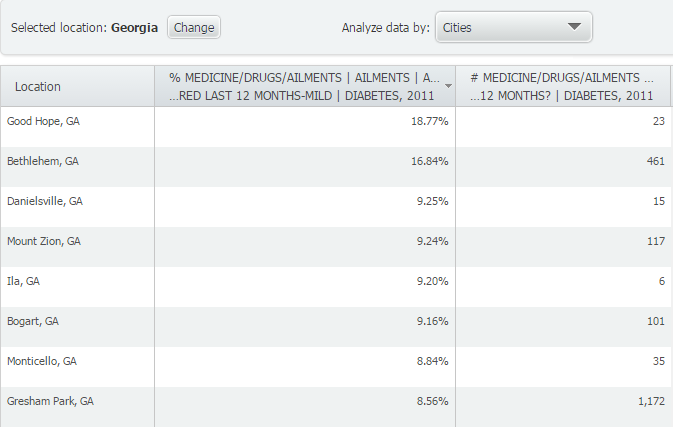
Location Analysis definition - view & compare data for all counties in a state, ZIP codes in a city, census tracts in a county, etc.
Location Analysis real-world use - A medical equipment provider may review health data in a Location Analysis to identify cities in the state to consider visiting to market equipment for an ailment.
Stay tuned for more SimplyMap tips, and don’t forget to follow us on Twitter and like us on Facebook!
More from SimplyAnalytics
Posted on Feb 19, 2016 by Admin
Drop by booth #857 at PLA 2016 to meet the SimplyMap team and learn more about the features and functions behind SimplyMap. Have a Ghirardelli Chocolate while we present SimplyMap and off...
Posted on Jun 09, 2021 by Admin
Hello readers! SimplyAnalytics will be exhibiting at the Virtual ALA Annual Conference this year on June 23-26. Be sure to drop by our booth, and click the banner image to video chat with...
Posted on Oct 07, 2024 by Admin
We're headed to Charleston! Come visit the SimplyAnalytics team on November 12th at the Gaillard Center at booth 41. We'll be doing live demonstrations of the database, answering question...
Posted on Mar 11, 2024 by Admin
We're thrilled to announce that SimplyAnalytics will be exhibiting at the ALA Annual Conference in San Diego! We can't wait to connect with library professionals, share insights, and show...
Posted on Nov 11, 2015 by Admin
Inspired by a recent help desk ticket, we wanted to discuss how users may utilize SimplyMap to identify relationships between unique variables. For example, does having a college degree s...
Posted on Nov 24, 2014 by Admin
In this week’s report, we research America’s most educated cities. SimplyMap contains a total of 111 educational attainment variables, including general population and by race. We used th...
Posted on Aug 20, 2015 by Admin
Is there a specific age group and income bracket you are specifically interested in researching for a target location? Our Life Stages module has the information you need. Life Stages, by...
Posted on Nov 20, 2015 by Admin
In a previous blog we demonstrated the power of utilizing multiple years for the same variable. We found that the usage of Amazon.com had grown substationally from 2008-2014. In this week...
Posted on Nov 17, 2014 by Admin
Our recent series Exploring SimplyMap Data Reports has focused on creating ranking reports for unique variables. Accordingly, we thought it would be helpful to write a quick tip on how to...
Posted on Jul 19, 2016 by Admin
Are you a tech wizard? Maybe you’re an apprentice? Learn more about technology consumption behaviors using the Simmons MOSAIC Technology Adoption segments located within the SimmonsLOCAL ...