


SimplyAnalytics at NCLA 2025 – Visit Us at Booth #225!
Posted on Sep 15, 2025 by Admin
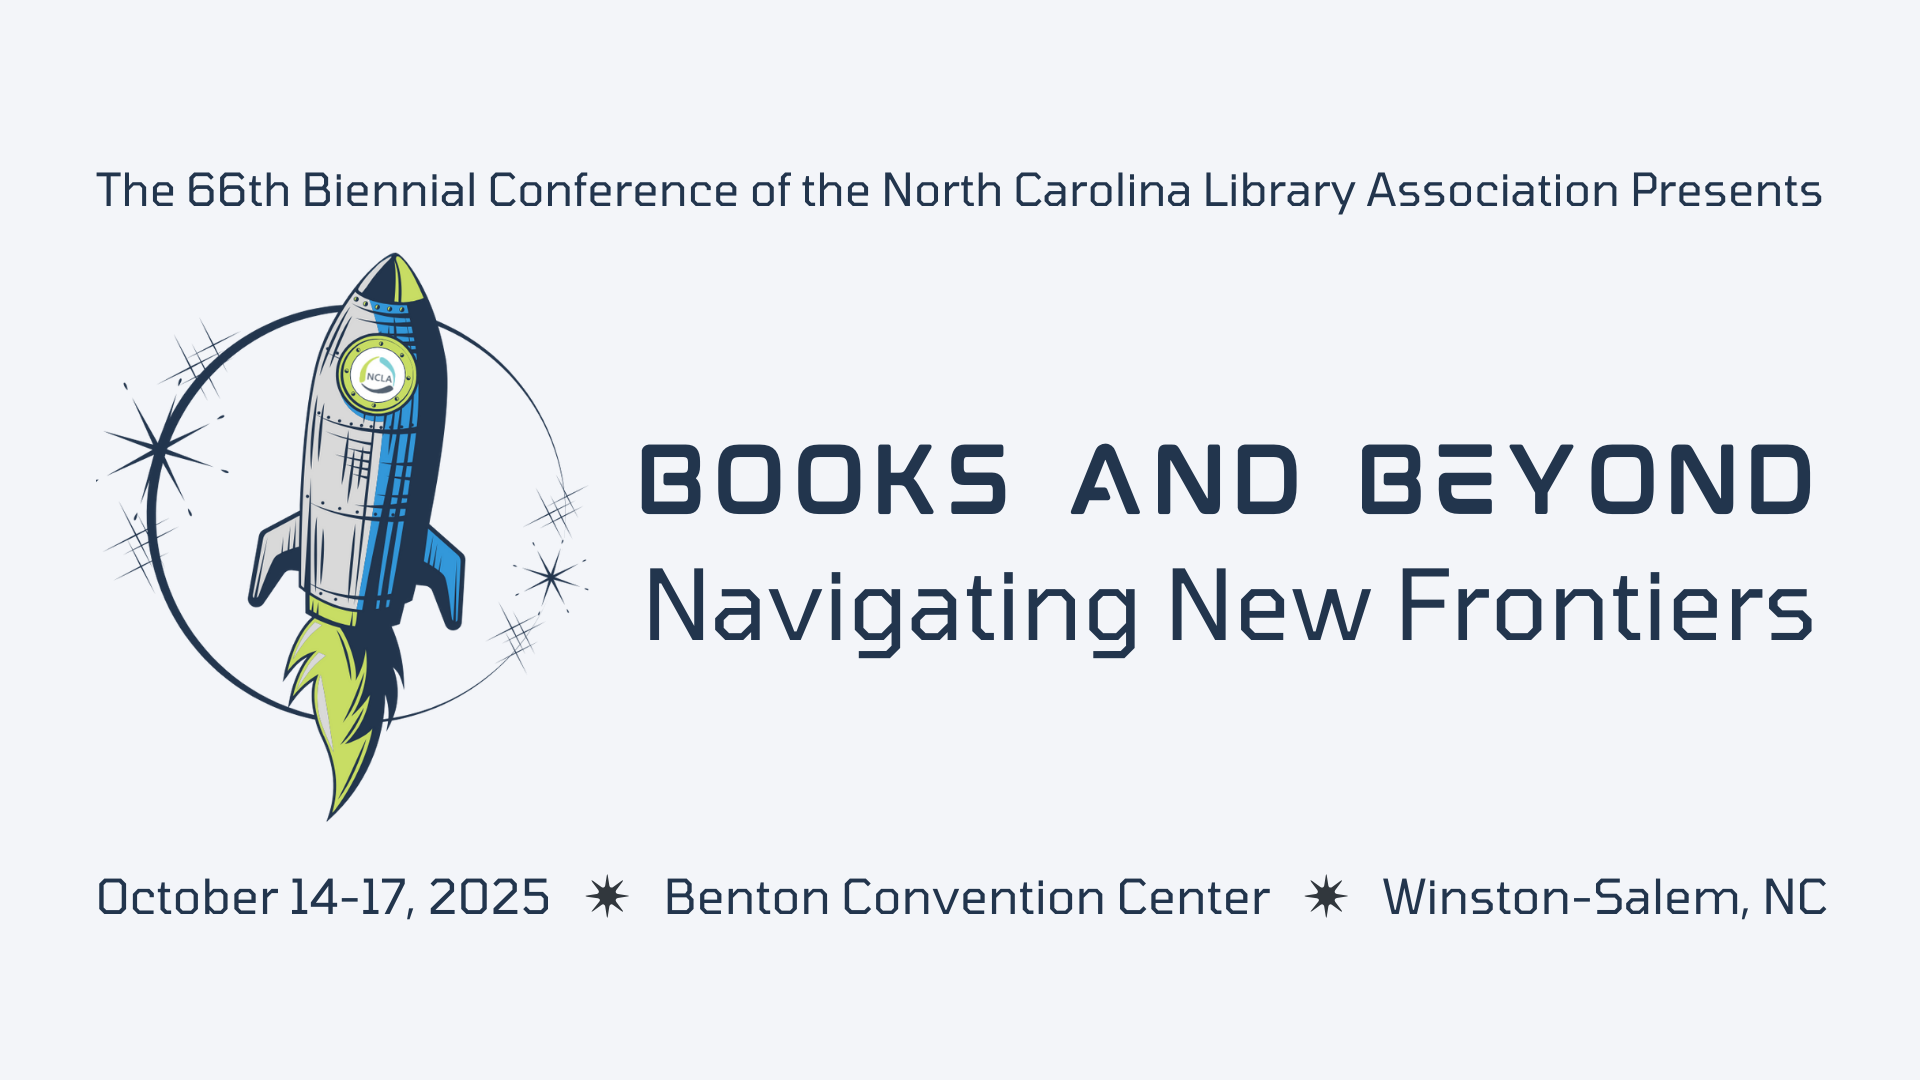
SimplyAnalytics will be attending the upcoming NCLA Conference in Winston-Salem October 14-17!
Stop by Booth #225 to explore how SimplyAnalytics helps libraries, educators, and researchers easily access powerful demographic, consumer behavior, business, and health data. Our team will be there to answer your questions, provide live demos and show you what’s new.
See you in North Carolina!
More from SimplyAnalytics
Posted on Dec 03, 2015 by Admin
With the Thanksgiving holiday last week, we decided to take a quick look into SimplyMap to see what pertinent variables are available for analysis. First, open the Variables panel and cli...
Posted on May 02, 2016 by Admin
Inspired by a recent support desk question, this week’s SimplyMap report will demonstrate how a user would run a business search that consists of multiple names. In short, the user was at...
Posted on Dec 06, 2009 by Admin
ALA's Choice Magazine, publisher of independent reviews of products and services for academic libraries, released a new review of SimplyMap in the December 2009 edition. The reviewer, Car...
Posted on Dec 02, 2014 by Admin
Today we take a look at one of the more advanced features in SimplyMap - editing the map legend. Editing the map legend is a great way to not only customize how the data is distributed on...
Posted on Jul 19, 2016 by Admin
Are you a tech wizard? Maybe you’re an apprentice? Learn more about technology consumption behaviors using the Simmons MOSAIC Technology Adoption segments located within the SimmonsLOCAL ...
Posted on Oct 24, 2019 by Admin
Hi everybody! This week we wanted to bring you something unique, so we’re taking you behind the scenes to show you what goes in to setting up the SimplyAnalytics conference booth you’ve c...
Posted on Jul 22, 2015 by Admin
In this week’s SimplyMap report, we take a look at one of our newly available data packages - ConneXions® from Nielsen. The ConneXions® segmentation system integrates consumer behavior an...
Posted on Feb 26, 2014 by Admin
The Statewide California Electronic Library Consortium is holding another packed week of workshops and networking during the SCELCapalooza event in March 2014. Geographic Research will b...
Posted on Jun 16, 2016 by Admin
This week’s SimplyMap report is a quick tip that we hope you find useful and time saving. Did you know that SimplyMap will save all recently searched business queries for future usage? Le...
Posted on Nov 28, 2012 by Admin
Come visit the SimplyMap team at the ALA Midwinter Meeting, January 25 - 28, 2013 in Seattle, WA. We will be in Booth 1307, and as always we look forward to meeting with customers new and...