 Go up
Go up


Exporting Shapefiles in SimplyMap
Posted on Oct 16, 2015 by Admin
Did you know that SimplyMap includes the ability to export Shapefile data for use in desktop mapping software (such as MapInfo or ArcGIS)? This advanced feature extends the power of SimplyMap and allows for increased data manipulation and mapping capabilities for advanced users or GIS professionals. Let’s take a look at the exporting process with an example.
To export shapefiles from any map, select Actions > Export Shapefiles.
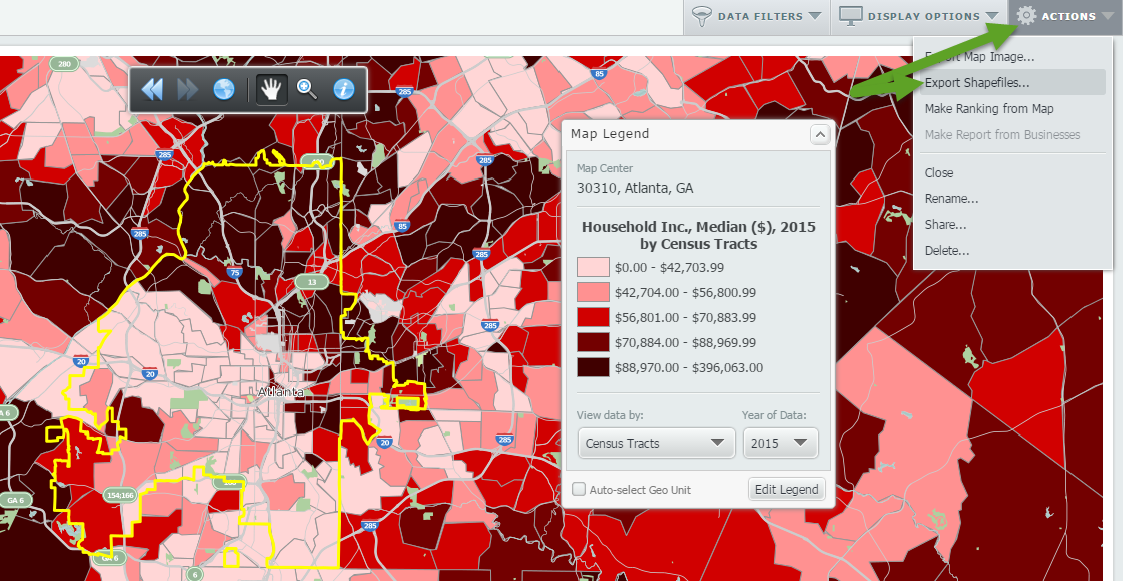
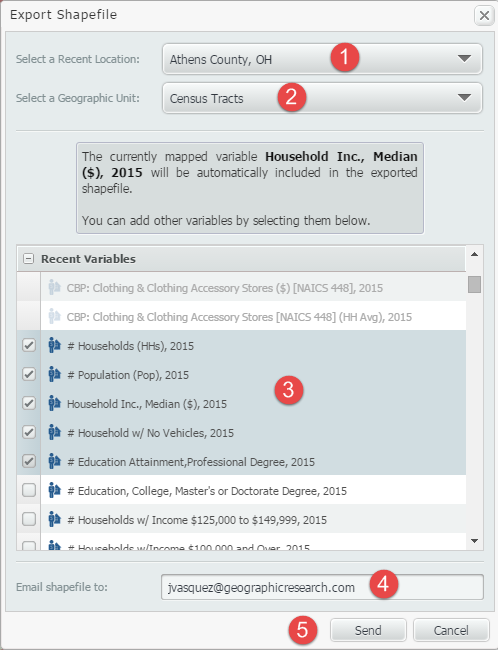
The shapefiles export menu will appear. Follow the 5 easy steps shown and depicted below to receive your shapefiles.
1. Select a Recent Location to export.
2. Select a Geographic Unit to export. You can select from States, Counties, Cities, ZIP Codes, Census Tracts and Census Block Groups.
3. Select data variables to export by clicking the checkbox located next to them. You can select from your Favorite or Recently-used Variables.
4. Enter an email address to send the shapefile to.
5. Click Send. A .zip file will be emailed to the address you entered shortly.
That’s all there is to it! When you receive the email, click on the link to download your files.
Note: Shapefile column names can only have a maximum of 10 characters, so we include a text file with your exported shapefile with complete variable names.
Stay tuned for more SimplyMap tips and reports. If there’s anything you would like to see explained more in depth, let us know below.
More from SimplyAnalytics


Posted on Dec 02, 2014 by Admin
Today we take a look at one of the more advanced features in SimplyMap - editing the map legend. Editing the map legend is a great way to not only customize how the data is distributed on...
Posted on Jun 01, 2014 by Admin
Visit the SimplyMap team at the ALA Annual Conference and Exposition in Las Vegas later this month. We will be at booth 1271, offering product demonstrations, tips & tricks, and of co...
Posted on Sep 18, 2015 by Admin
With tens of thousands of variables available in SimplyMap, it’s common for users to wonder whether or not a particular variable they have in mind is available in SimplyMap. This is where...
Posted on Aug 13, 2015 by Admin
In this quick SimplyMap report, we use Census data to help us identify which city in the United States has the highest percentage of residents who reported walking to work as their mode o...
Posted on May 02, 2016 by Admin
Inspired by a recent support desk question, this week’s SimplyMap report will demonstrate how a user would run a business search that consists of multiple names. In short, the user was at...
Posted on Oct 22, 2008 by Admin
Excerpt from University of Iowa Library blog: In your marketing class, you may be developing a marketing plan for a pre-made meals restaurant specializing in vegetarian menus in Chicagola...
Posted on Sep 10, 2010 by Admin
SimplyMap Canada is now available at several Canadian institutions, including York University and Ryerson University, in Toronto. SimplyMap Canada has all of the great features included i...
Posted on Aug 30, 2009 by Admin
Jeff Zaslow, Wall Street Journal columnist and co-author of the The Last Lecture, will speak at the Orlando, FL Public Library on Friday, September 11 at 7 p.m. Zaslow helped the late Ran...
Posted on Nov 28, 2012 by Admin
Come visit the SimplyMap team at the ALA Midwinter Meeting, January 25 - 28, 2013 in Seattle, WA. We will be in Booth 1307, and as always we look forward to meeting with customers new and...
Posted on Apr 05, 2019 by Admin
Come visit the SimplyAnalytics booth (325) at the upcoming ACRL 2019 show in Cleveland! Say hello, grab a chocolate, and stay for a quick demo of SimplyAnalytics. The team will be showcas...