


Exploring SimplyMap Data: America’s Coffee Drinkers
Posted on Feb 05, 2015 by Admin
In this week’s edition of exploring SimplyMap data, we take a look at America’s coffee drinkers. SimplyMap contains more than 100 coffee related variables, including consumer spending on coffee by brand and by number of coffee cups consumed per day. For this example, lets look at a broader indicator related to coffee - whether or not a household uses coffee at all. The variable, % BEVERAGES - NON-ALCOHOLIC DRINKS | GROUND OR WHOLE BEAN COFFEE | GROUND OR WHOLE BEAN COFFEE-HH USES? | YES, 2013 can be found in the SimmonsLOCAL folder. SimmonsLOCAL is a profiling system that provides insights into consumer behavior for 210 American media markets on a local level with 60,000+ data variables, including over 450 categories and 8,000 specific brands. It is a powerful resource that provides insight into consumer spending and behavior, and very popular with business students and researchers. We begin by creating a ranking report, and setting the geography to USA. Next, under the Analyze Data By drop down, select states. The results are shown below:
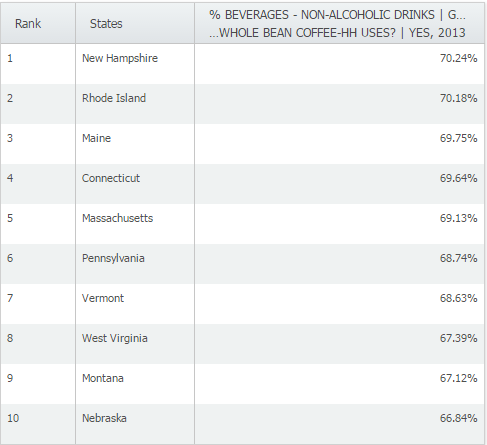 At 70.24%, New Hampshire narrowly edges out Rhode Island (70.18%) and Maine (69.75%) as the top states for household coffee drinking in the US. When we analyze by City, (by again adjusting the Analyze Data By drop down), and apply a population filter of greater than 75,000, the following cities make the top 10.
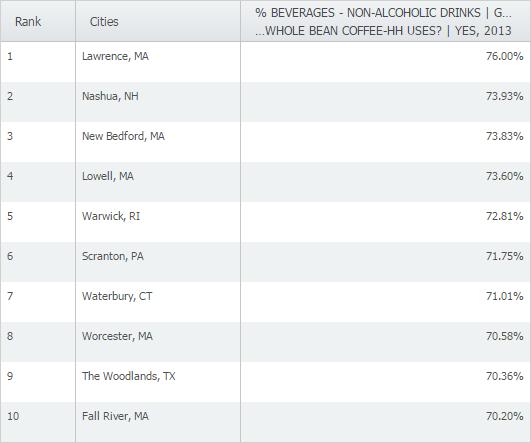 The residents of Lawrence, MA claim the top spot in the US (cities with population > 75k) for coffee drinkers at home. Lastly, we viewed the city of Lawrence by census tract.
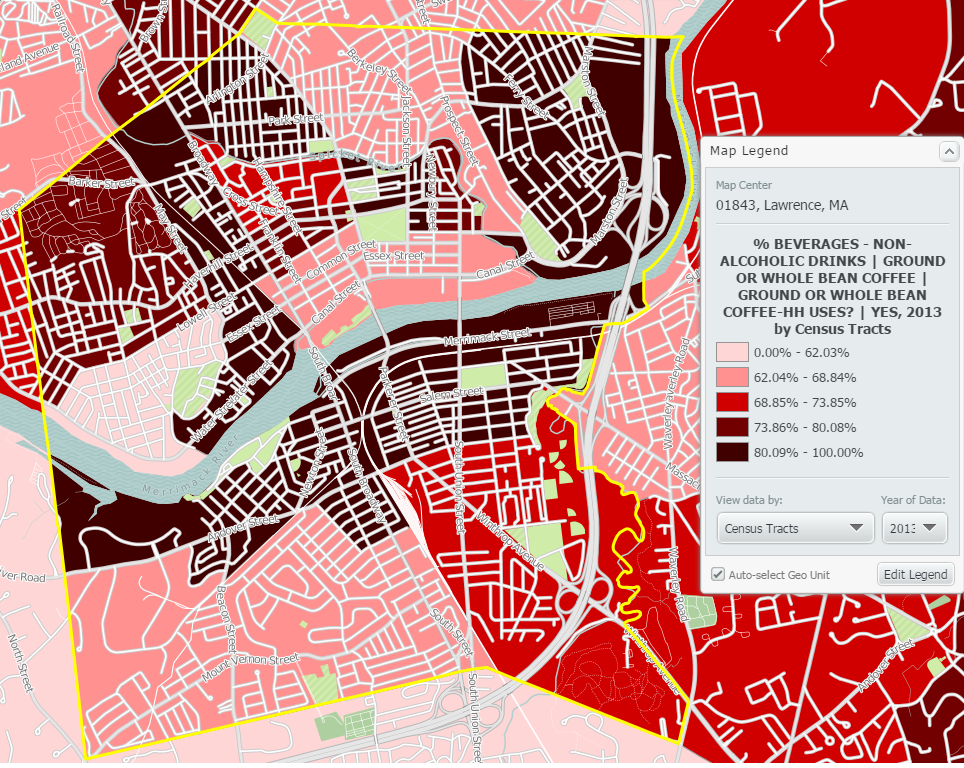 It looks like many of the residents in Lawrence, MA drink their coffee by the Merrimack River. What insights can be drawn from this? What other questions arise? Are there specific characteristics of these States, Cities, or Census Tracts that make their residents more inclined to drink coffee at home? Let us know your thoughts in the comments! Stay tuned for more SimplyMap tips and reports! Don’t forget to follow us on Twitter and like us on Facebook to stay up to date on all things SimplyMap (and score an entry to our iPad and Kindle Fire raffle while you are at it!).
More from SimplyAnalytics
Posted on Jan 27, 2015 by Admin
In this week’s report exploring SimplyMap data, we take a look at where America’s bookworms reside. To find this data, we used the variable, Reading (Household Average), 2014 found in the...
Posted on Sep 10, 2010 by Admin
SimplyMap Canada is now available at several Canadian institutions, including York University and Ryerson University, in Toronto. SimplyMap Canada has all of the great features included i...
Posted on Aug 22, 2009 by Admin
Lynda Kellam, the Data Services & Government Information Librarian at the University of North Carolina, Greensboro has produced some new tutorial videos to help students learn how to ...
Posted on Feb 26, 2014 by Admin
The Statewide California Electronic Library Consortium is holding another packed week of workshops and networking during the SCELCapalooza event in March 2014. Geographic Research will b...
Posted on Jan 10, 2024 by Admin
We are delighted to announce our sponsorship of the Midwest Entrepreneurship Case Competition! At SimplyAnalytics, we understand the power of data-driven decision-making in entrepreneursh...
Posted on Jan 15, 2013 by Admin
The GRI team is looking forward to exhibiting at ACRL 2013 at the Indiana Convention Center in Indianapolis April 10 - 12, 2013. Every other year, ACRL offers its premier professional dev...
Posted on Feb 14, 2017 by Admin
In previous blog entries, we highlighted the value of having a mapping application to complement premium data when analyzing America's geographic preferences in credit cards, and mayonnai...
Posted on Mar 03, 2016 by Admin
In this week’s SimplyMap report we take a look into the SimmonsLOCAL dataset to determine which cities in America have the highest percentage of residents who consume organic food product...
Posted on Nov 24, 2014 by Admin
In this week’s report, we research America’s most educated cities. SimplyMap contains a total of 111 educational attainment variables, including general population and by race. We used th...