


Exploring SimplyMap Data: P$YCLE
Posted on Apr 28, 2016 by Admin
In this week’s SimplyMap report we’ll take a look at one of our newer data packages offered, P$YCLE® by Nielsen.
P$YCLE® is a segmentation system that evaluates consumers using key demographic factors that have the greatest effect on their financial behaviors, such as income, age, presence of children, home ownership and Nielsen' proprietary measure of Income Producing Assets (IPA). The result is a total of 58 P$YCLE® segments, within 12 P$YCLE Lifestage Groups, each with distinct usage patterns for financial and investment products and services.
Let’s take a look at the top segments from a few cities around the US. First, create a new Standard Report (under New Tabular Report > Standard Report). Next, open the variables panel and navigate to the P$YCLE® segments folder - from there, select Add All Variables from the action dropdown that appears. Close out the panel to generate your report for the US.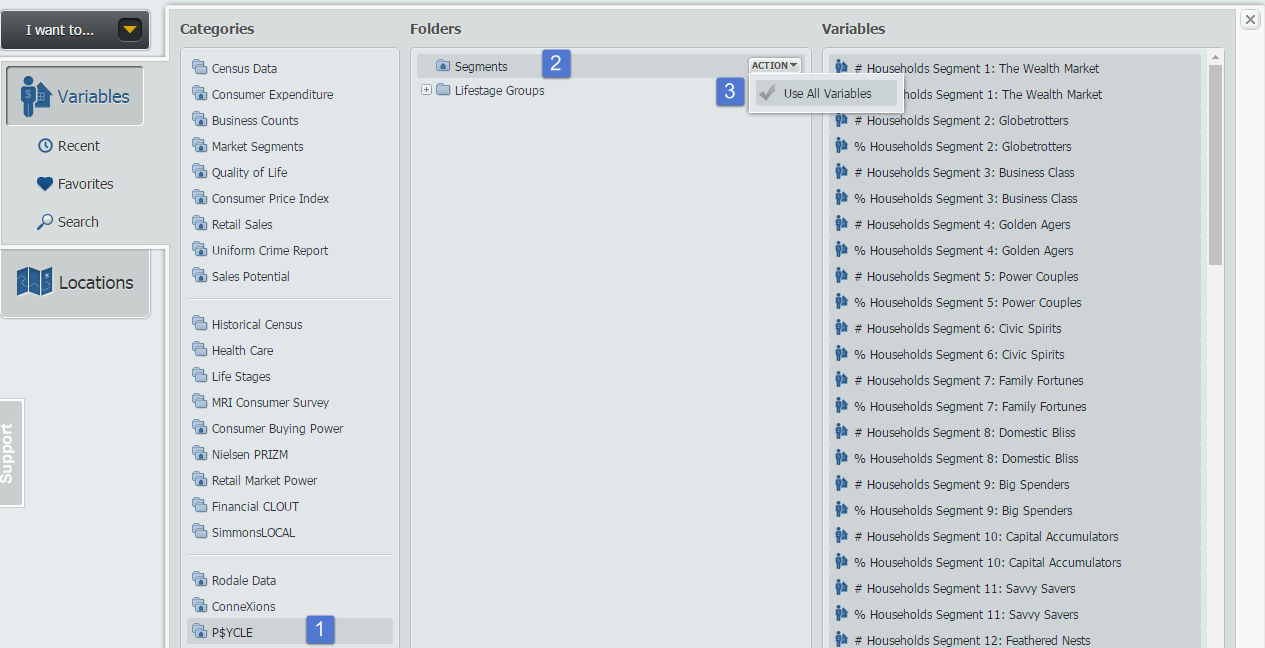
Hover over the Location header in your report and select Sort Descending to view the top segment for the United States:
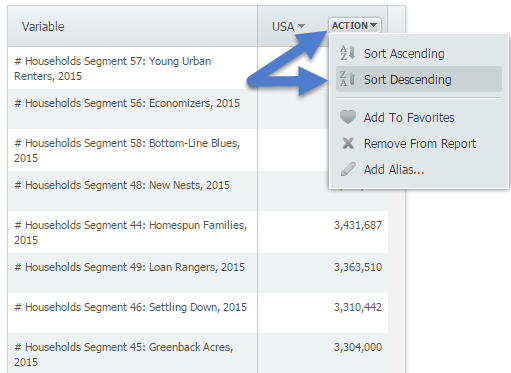
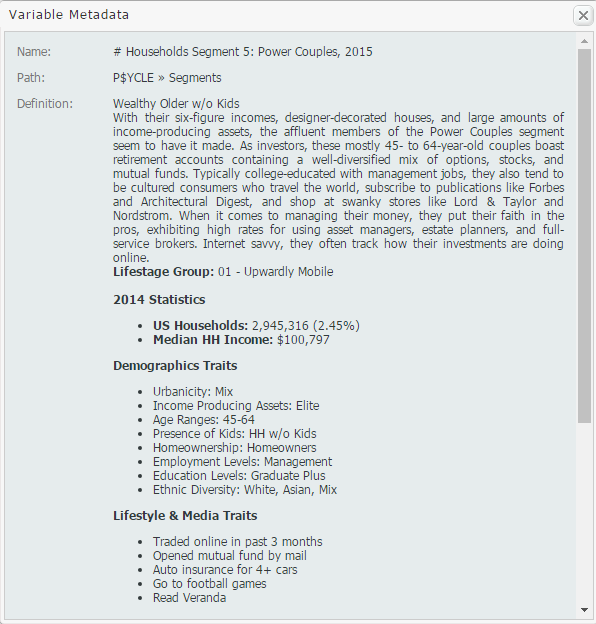
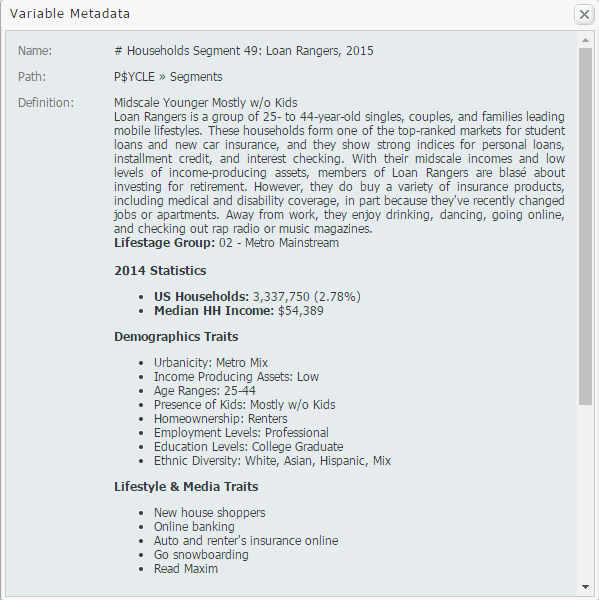
The top segment for the United States is Segment 57: Young Urban Renters. To read more about this segment, hover over the variable and select View Metadata.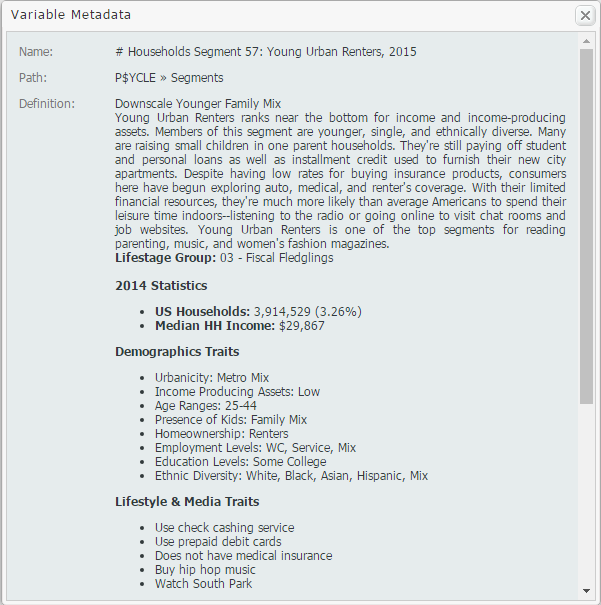
Lastly, add some locations of interest to your report and repeat the process above for each heading to view its highest segment. Results below!
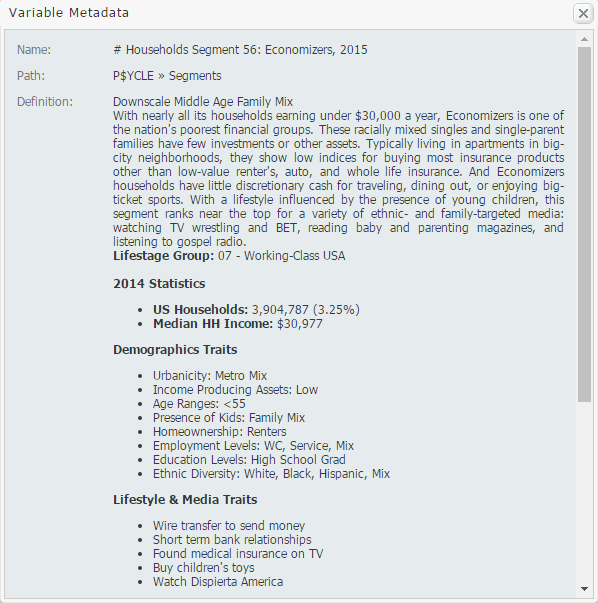
Houston, TX - Segment 56: Economizers
San Francisco, CA - Segment 5: Power Couples
Pittsburgh, PA - Segment 49: Loan Rangers
We hope you enjoyed this week’s SimplyMap report reviewing the P$YCLE® data set - if your institution is interested in a trial of this package, please email support@geographicresearch.com
More from SimplyAnalytics
Posted on May 06, 2016 by Admin
Visit us at booth #775 at the ALA 2016 annual conference to meet the SimplyMap team and learn more about the features and functions behind SimplyMap. Have a Ghirardelli Chocolate while we...
Posted on Mar 13, 2023 by Admin
Hello readers! Today, we’re excited to officially introduce the Location Query Report in SimplyAnalytics. The Location Query Report is a powerful feature in SimplyAnalytics that allows us...
Posted on May 23, 2019 by Admin
Come visit the SimplyAnalytics team at the Special Library Association's Annual Conference in Cleveland. Special librarians and other information professionals come together at SLA’s annu...
Posted on Sep 27, 2019 by Admin
Hello readers! This week we provide an in-depth response to a question asking about the legend classification methods in SimplyAnalytics. This response is now part of our Help Center: htt...
Posted on Jun 08, 2015 by Admin
In this week’s report we take a look at one folder found within SimplyMap’s SimmonsLOCAL data package. SimmonsLOCAL is a powerful targeting and profiling system that provides insights int...
Posted on Sep 15, 2016 by Admin
While creating a radius location is the fastest and easiest method for creating a custom location, there may be situations that require a more specific and targeted locale. Let’s say for ...
Posted on Nov 06, 2014 by Admin
With over 75,000 variables in SimplyMap, you can find virtually any information you want. This week, we take a look at which U.S. locations spend the most money eating at restaurants or c...
Posted on Mar 02, 2018 by Admin
In this week’s blog we’ll take a look at how to enter an address in SimplyAnalytics to find the Census Block Group or Census Tract. Let’s get started! Use Case: You want to analyze the ar...
Posted on Feb 27, 2015 by Admin
SimplyMap is an excellent tool for market research, and it’s made even more powerful by Nielsen PRIZM data. Nielsen PRIZM is the highest quality market segment data available. Every house...
Posted on Jun 09, 2021 by Admin
Hello readers! SimplyAnalytics will be exhibiting at the Virtual ALA Annual Conference this year on June 23-26. Be sure to drop by our booth, and click the banner image to video chat with...