


Creating a Custom Location from a Map
Posted on Sep 15, 2016 by Admin
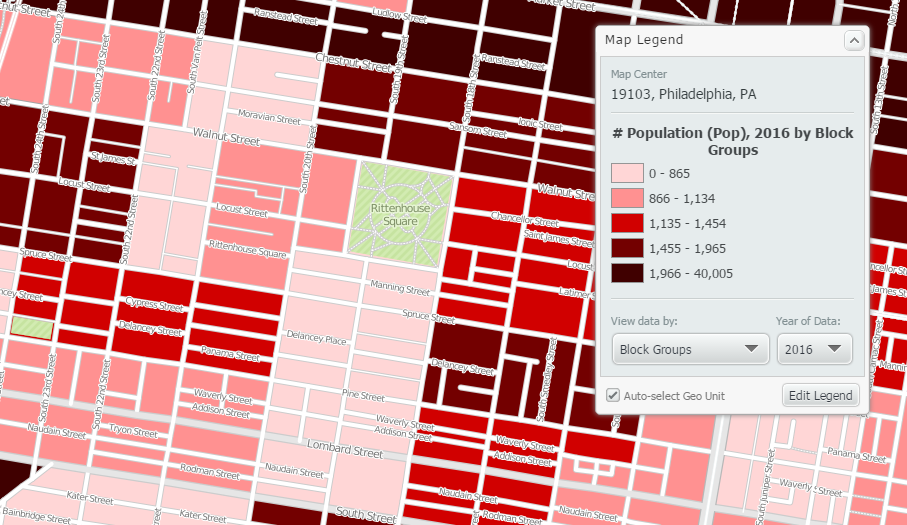
While creating a radius location is the fastest and easiest method for creating a custom location, there may be situations that require a more specific and targeted locale. Let’s say for example that our target area for analysis are a few neighborhoods located west of Rittenhouse Square Park in Philadelphia.
A radius location would not work in this example as it will include all areas within a defined radius (e.g., 5 miles) around a specific block group. Using the process outlined below will allow you to focus in on the specific areas west of Rittenhouse Square Park, and create a custom location directly from a map. Let’s get started!
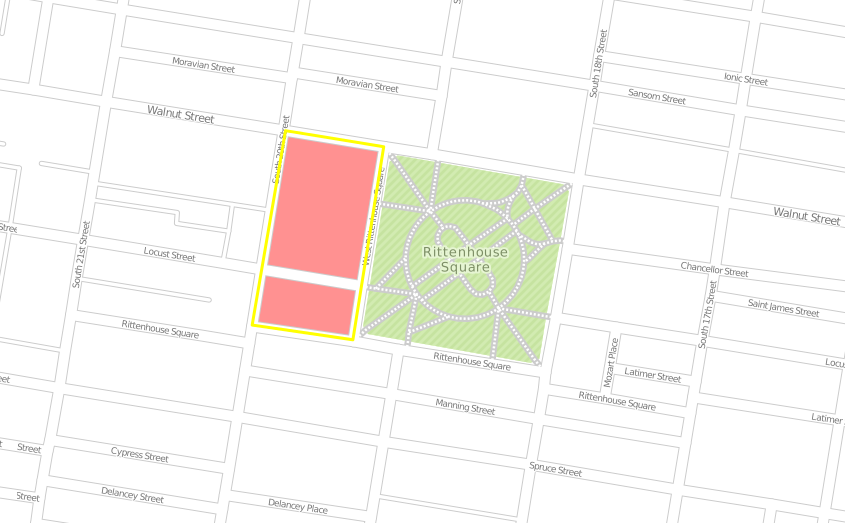
First, zoom in on the target area that will make up the custom location.
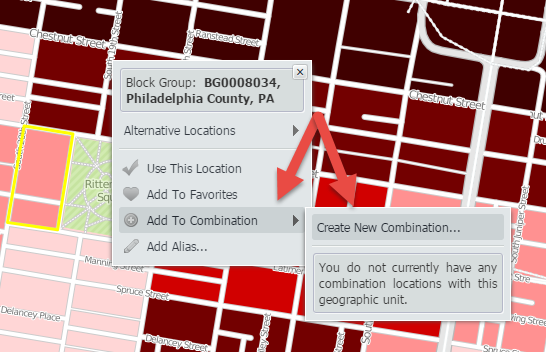
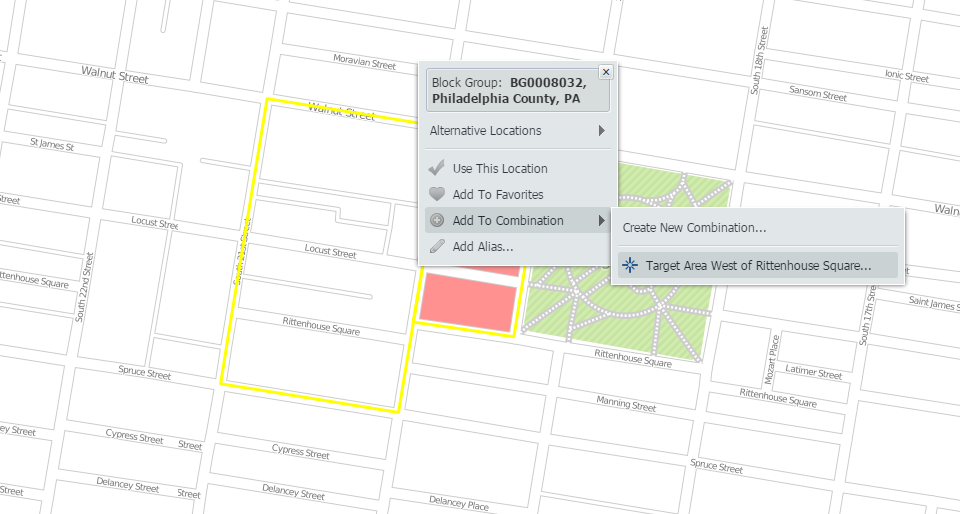
Utilize the i-tool and select the first area that will be included in your custom location. Hover over Add to Combination to select the option Create New Combination.
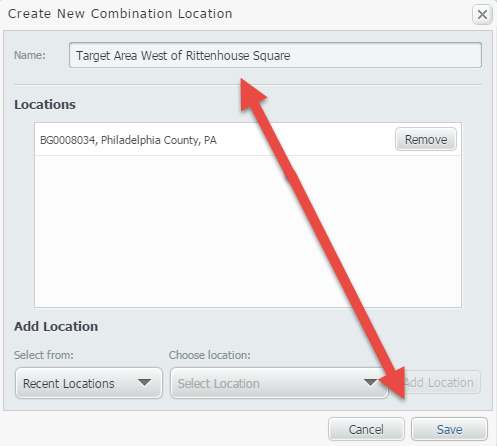
Give your location a name, and click save.
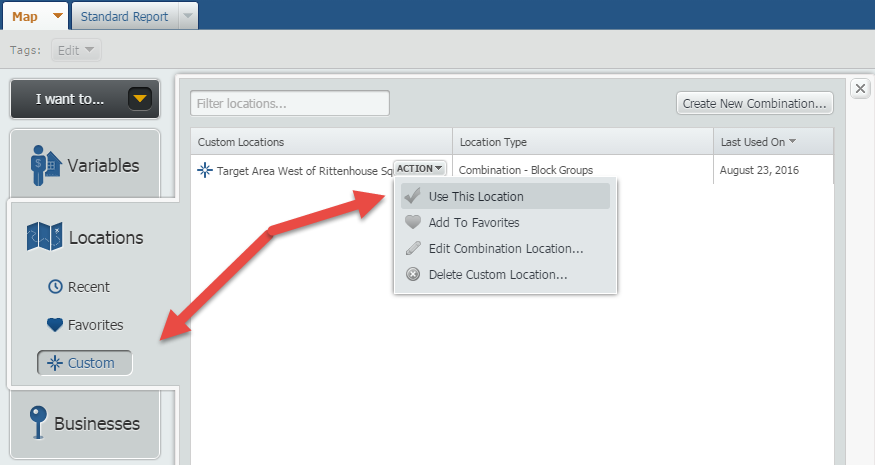
With the Combination now created, open the Locations panel, click on Custom and use the newly created combination.
Your map will now look like this (with the one location we clicked on earlier):
Note: We applied a Location Mask to remove colors outside of our target area (shown in white now).
Use the i-tool once more, and repeat the process above adding new locations into the combination location:
Final result:
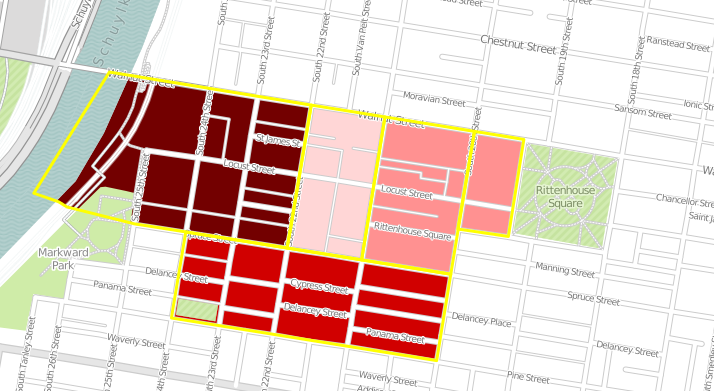
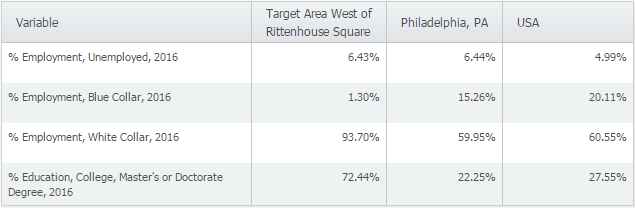
With the target area now created, you can utilize it in both maps and reports for further analysis.
Stay tuned for more SimplyMap tips and how-to’s!
More from SimplyAnalytics
Posted on Jun 02, 2017 by Admin
We will be exhibiting at SLA in Phoenix, AZ on June 18th-20th. You can find the SimplyAnalytics team at Booth #905. Stop by and check out our groundbreaking new interface, have a chocolat...
Posted on Nov 06, 2014 by Admin
With over 75,000 variables in SimplyMap, you can find virtually any information you want. This week, we take a look at which U.S. locations spend the most money eating at restaurants or c...
Posted on Feb 21, 2018 by Admin
We are looking forward to attending our first Electronic Resources & Libraries (ER&L) conference in Austin, TX! Visit us at Table #510 for a closer look at SimplyAnalytics – the b...
Posted on Jan 24, 2009 by Admin
Men's Health magazine took a look this month at where our wireless habits are most out of control. Their methodology includes the use of SimplyMap: First, we crunched data from SimplyMap...
Posted on Nov 06, 2013 by Admin
SimplyMap includes a number of helpful support tools; guided wizards available when and where you need them, detailed help files, and an online support center with FAQs and searchable kno...
Posted on May 06, 2016 by Admin
Visit us at booth #775 at the ALA 2016 annual conference to meet the SimplyMap team and learn more about the features and functions behind SimplyMap. Have a Ghirardelli Chocolate while we...
Posted on Feb 24, 2019 by Admin
We will be exhibiting at SCELC* Vendor Day on March 14th. Visit us at table 510 and attend one of our two sessions demonstrating SimplyAnalytics. The presentations will highlight newly av...
Posted on Nov 11, 2015 by Admin
Inspired by a recent help desk ticket, we wanted to discuss how users may utilize SimplyMap to identify relationships between unique variables. For example, does having a college degree s...
Posted on Jun 02, 2016 by Admin
Three weeks ago we utilized the SimmonsLOCAL data set to visualize contiguous America’s mayonnaise brand preference. Staying with the American visualization theme, this week’s report will...
Posted on Sep 01, 2008 by Admin
The King County Library System in Washington State now subscribes to SimplyMap, and has published a brief review on their blog, Library Talk.