


Identifying Top PRIZM Segments
Posted on Feb 27, 2015 by Admin
SimplyMap is an excellent tool for market research, and it’s made even more powerful by Nielsen PRIZM data. Nielsen PRIZM is the highest quality market segment data available. Every household in the United States is assigned to one of 66 segments, and Nielsen provides detailed information about each segment, such as demographic characteristics, shopping habits, financial and technology preferences, media habits, and much more.
PRIZM segments define every U.S. household in terms of 66 demographically and behaviorally distinct types, or "segments," to help marketers discern those consumers’ likes, dislikes, lifestyles and purchase behaviors. Used by thousands of marketers within Fortune 500 companies, PRIZM provides the "common language" for marketing in an increasingly diverse and complex American marketplace.
Let’s start by identifying the largest PRIZM segments in some target locations.
First, create a Standard Report using your target locations. We’ll compare some different ZIP codes within and including the city of Boston, MA. Next, navigate to the PRIZM segments. You will want to select each # segment within that folder. Lastly, close the window to generate your report.
To locate the highest segment within each location, hover over a location and select Sort Descending. SimplyMap will reprocess the report, showing the highest figure at the top for the selected location.
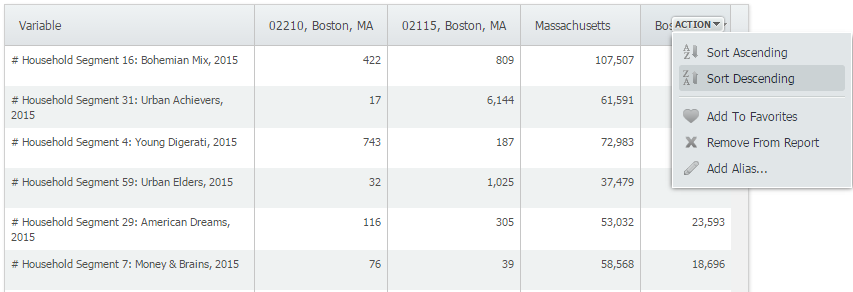 Here are the results for each ZIP code and the city of Boston.
02210: Young Digerati
02115: Urban Achievers
Boston: Bohemian Mix
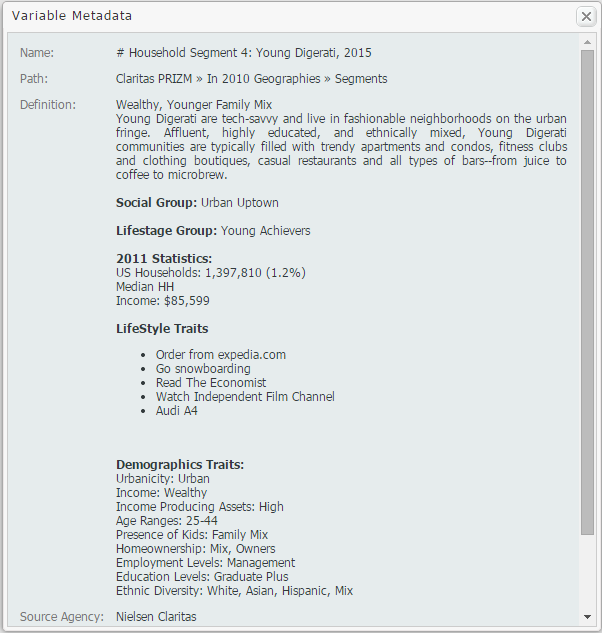
To find out more information about each segment, hover over the segment and select View Metadata. The metadata for each segment above is presented below:
ZIP Code 02210: Young Digerati
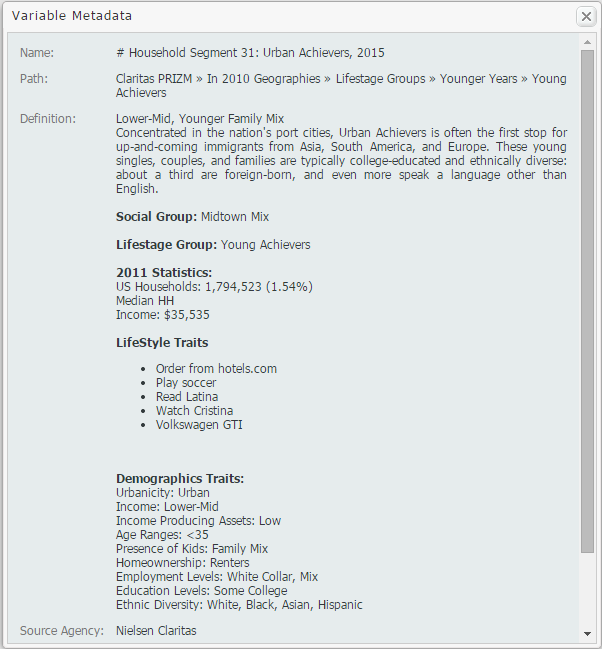
ZIP Code 02115: Urban Achievers
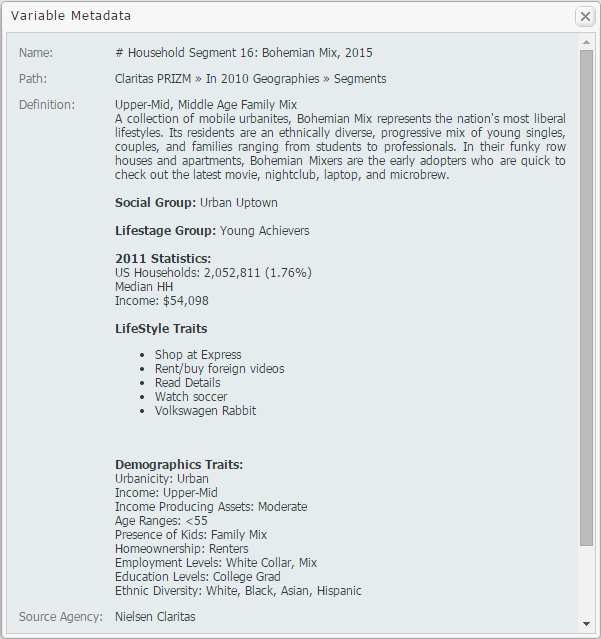
Boston, MA: Bohemian Mix Metadata
We hope you enjoyed this week’s blog. Stay tuned for more reports and SimplyMap tips! If you haven’t already, don’t forget to follow us on Twitter and Like Us on Facebook to get yourself entered into our Winter Sweepstakes!
More from SimplyAnalytics
Posted on Feb 27, 2015 by Admin
SimplyMap is an excellent tool for market research, and it’s made even more powerful by Nielsen PRIZM data. Nielsen PRIZM is the highest quality market segment data available. Every house...
Posted on May 18, 2015 by Admin
The SimplyMap team is looking forward to visiting with customers and others at the SLA Annual Conference, coming to Boston on June 14-16. Come visit us at Booth #916, we are happy to answ...
Posted on Apr 17, 2018 by Admin
The SimplyAnalytics team would like to congratulate Rachel Holder, MLS candidate at Indiana University for being selected as this year's recipient of the BRASS Student Travel Award! ...
Posted on Jan 29, 2016 by Admin
In a previous blog entry, we highlighted the benefits of having multiple years of data available for the same variable. This allows users to identify trends over time. Keeping with the sa...
Posted on Jun 09, 2021 by Admin
Hello readers! SimplyAnalytics will be exhibiting at the Virtual ALA Annual Conference this year on June 23-26. Be sure to drop by our booth, and click the banner image to video chat with...
Posted on Oct 24, 2019 by Admin
Hi everybody! This week we wanted to bring you something unique, so we’re taking you behind the scenes to show you what goes in to setting up the SimplyAnalytics conference booth you’ve c...
Posted on Sep 21, 2009 by Admin
The North Carolina Library Association will hold its annual conference in Greenville, NC at the Greenville Convention Center from October 6-8, 2009. Geographic Research, Inc. will be exhi...
Posted on Sep 05, 2019 by Admin
SimplyAnalytics will be exhibiting at the biennial North Carolina Library Association conference, to be held this year at the Winston-Salem Benton Convention Center. If you are attending,...
Posted on Feb 26, 2014 by Admin
The Statewide California Electronic Library Consortium is holding another packed week of workshops and networking during the SCELCapalooza event in March 2014. Geographic Research will b...
Posted on Mar 02, 2009 by Admin
ACRL's 14th National Conference will be held at the Washington State Trade and Convention Center in downtown Seattle, March 12-15, 2009. Every other year, ACRL offers its premier profe...