


Exploring SimplyMap Data: SimmonsLOCAL Lifestyle Statements
Posted on Jun 08, 2015 by Admin
In this week’s report we take a look at one folder found within SimplyMap’s SimmonsLOCAL data package. SimmonsLOCAL is a powerful targeting and profiling system that provides insights into consumer behavior for all of America's 210 media markets on a local level with 60,000+ data variables, including over 450 categories and 8,000 specific brands.
The folder we are looking at today is the Lifestyle Statements folder. Here you will find 26 unique lifestyle statement subcategories ranging from attitude and opinions on apparel, to diet and health statements. The picture below shows the options available.
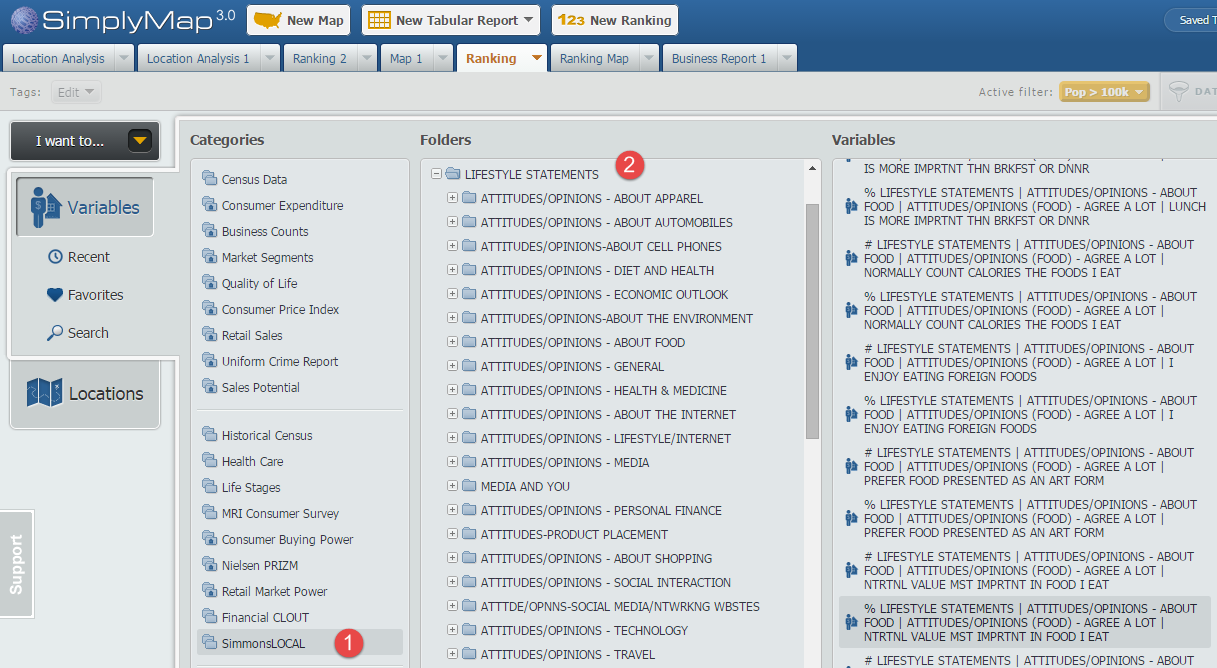
In this showcase we will create a Ranking Report using the variable statement AGREE A LOT - NUTRITIONAL VALUE MOST IMPORTANT IN FOOD I EAT. This can be found at this path:
SimmonsLOCAL » LIFESTYLE STATEMENTS » ATTITUDES/OPINIONS - ABOUT FOOD » ATTITUDES/OPINIONS (FOOD) - AGREE A LOT
First, select New Ranking found at the top of SimplyMap. Next, click on Variables and navigate through the above path to locate the variable.
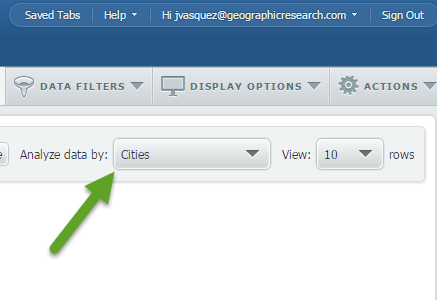
Under locations, select USA as your geography and use the Analyze Data By functionality to select Cities.
Apply a population filter (read more about using filters here) to only show cities with 100,000 or more residents, and the final result will look like this:
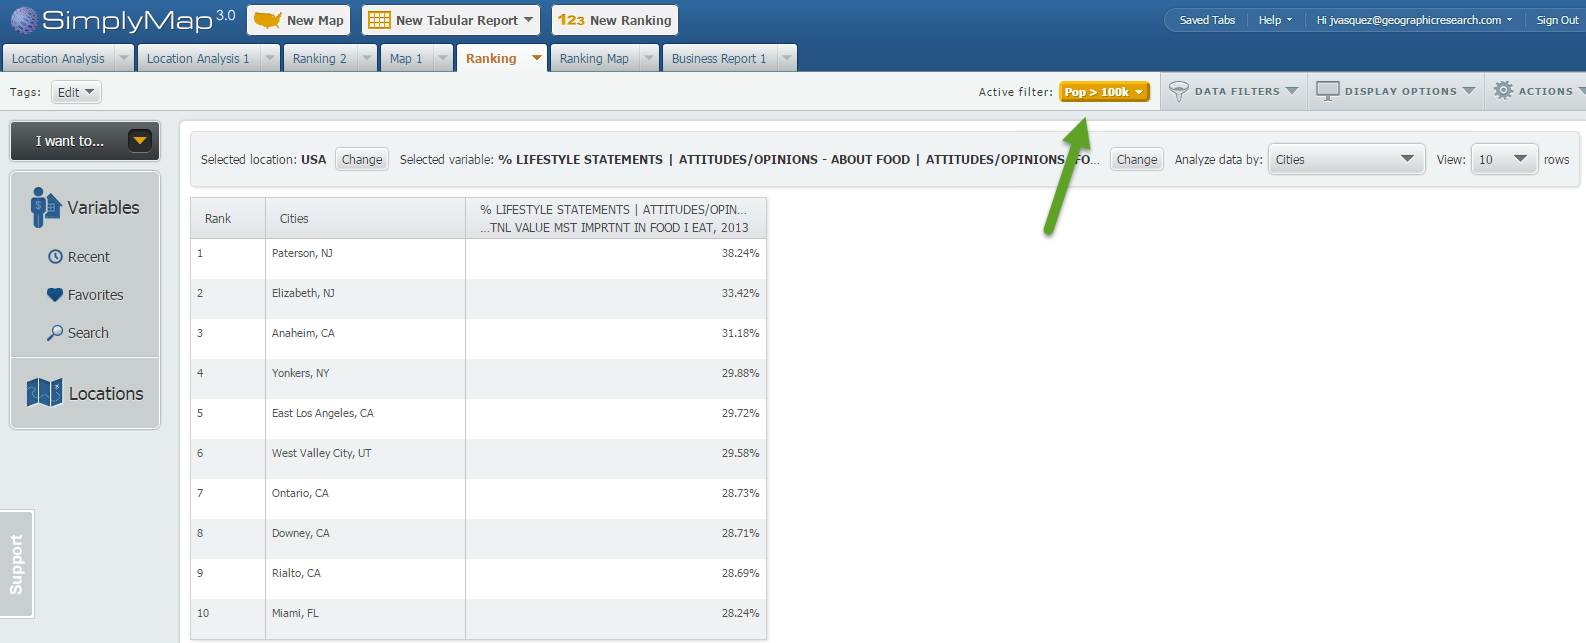
Note: you can see your applied filter located towards the top of your report by the Active Filter text.
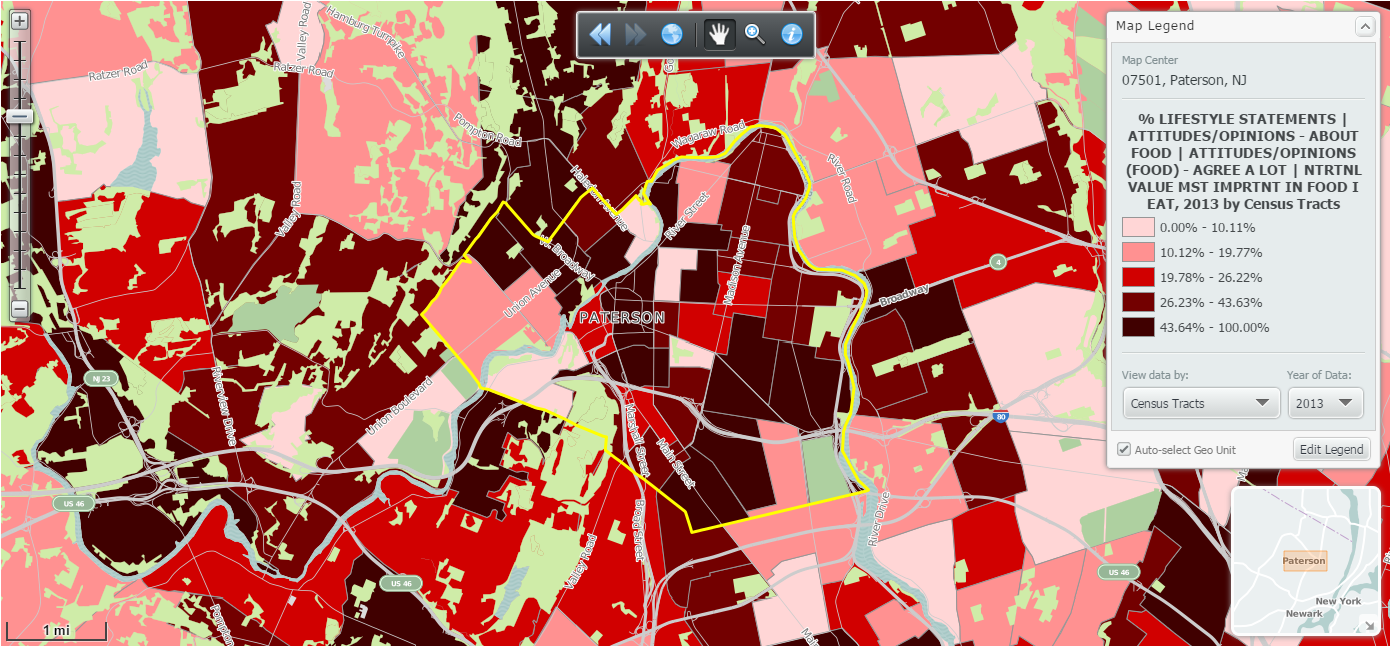
At 38.24% Paterson, NJ ranks first in the United States (cities > 100k) for folks who agree a lot with the statement: NUTRITIONAL VALUE MOST IMPORTANT IN FOOD I EAT.
To quickly map Paterson, NJ hover over the location and select Create Map:
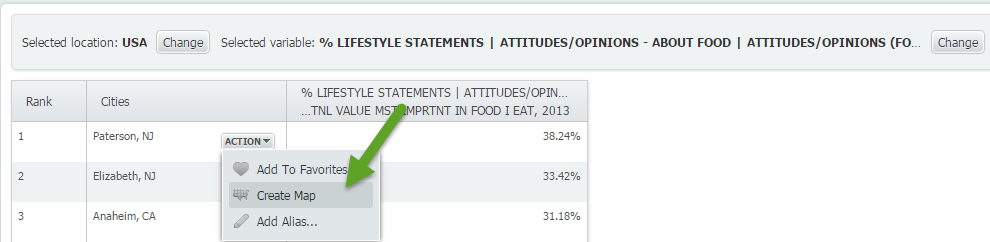
Map of Paterson, NJ:
We hope you enjoyed this look into the SimmonsLOCAL data set. With over 60,000 variables in the package, we will be posting many more variable spotlight reports.
Don’t forget to follow us on Twitter, and Like Us on Facebook to stay up to date with SimplyMap.
More from SimplyAnalytics
Posted on Aug 20, 2015 by Admin
Is there a specific age group and income bracket you are specifically interested in researching for a target location? Our Life Stages module has the information you need. Life Stages, by...
Posted on Sep 21, 2009 by Admin
The North Carolina Library Association will hold its annual conference in Greenville, NC at the Greenville Convention Center from October 6-8, 2009. Geographic Research, Inc. will be exhi...
Posted on Jan 28, 2010 by Admin
Come visit the Geographic Research booth at the Ontario Library Association Super Conference, February 24-27, 2010 at the Metro Toronto Convention Centre. The Ontario Library Association ...
Posted on Mar 30, 2016 by Admin
In previous blog entries we highlighted the usefulness of viewing multiple years of data for the same variable. In short, analyzing the same variable across multiple years allows users to...
Posted on Jul 22, 2015 by Admin
In this week’s SimplyMap report, we take a look at one of our newly available data packages - ConneXions® from Nielsen. The ConneXions® segmentation system integrates consumer behavior an...
Posted on Nov 06, 2013 by Admin
SimplyMap includes a number of helpful support tools; guided wizards available when and where you need them, detailed help files, and an online support center with FAQs and searchable kno...
Posted on May 23, 2012 by Admin
We will be exhibiting at the Special Libraries Association (SLA) annual conference and Info-Expo at McCormick Place in Chicago Sunday June 15th - Tuesday July 17th. Visit us at Booth 124 ...
Posted on Mar 10, 2011 by Admin
The GRI team is looking forward to exhibiting at ACRL 2011 at the PA Convention Center in Philadelphia, March 30 - April 1, 2011. Every other year, ACRL offers its premier professional d...
Posted on Apr 17, 2009 by Admin
The Special Libraries Association will hold its Annual Conference in Washington, DC at the Washington Walter E. Washington Convention Center from June 14-17 2009. The conference will crea...
Posted on Feb 17, 2015 by Admin
Our recent trip to Chicago exhibiting at the ALA Midwinter Meeting inspired this week’s SimplyMap blog post. Today, we’re going to demonstrate how to use business points in SimplyMap to a...