


The Location Query Report
Posted on Mar 13, 2023 by Admin
Hello readers! Today, we’re excited to officially introduce the Location Query Report in SimplyAnalytics. The Location Query Report is a powerful feature in SimplyAnalytics that allows users to quickly and easily identify target locations. This report is especially useful for businesses, researchers, and marketers who are looking to find some locations based on their desired conditions. Think of this report as a reimagining of the data filters, where we’ve put that functionality into a report and made it easier to understand what you are viewing. Let’s take a look at an example.
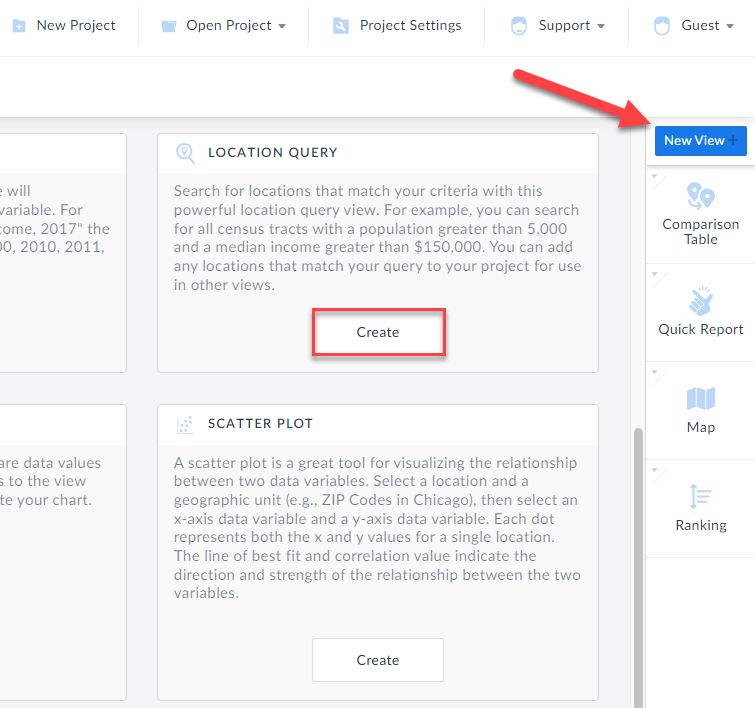
How to Create this Report:In your project, click on New View > “Create” Under the Location Query report
The Location Query report appears. Some tips in the image below of the layout:
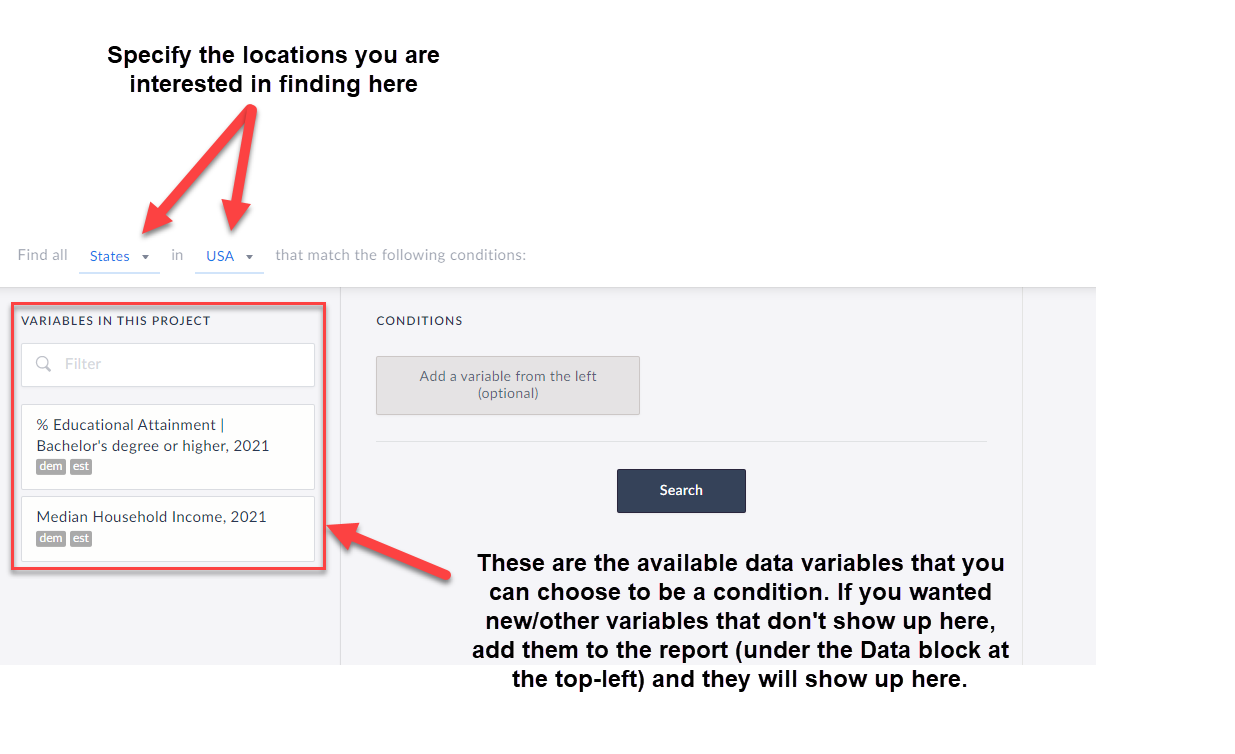
To begin the query, first choose from the dropdown at the top that reads: Find all X in Y that match the following conditions. This is where to choose which locations you are looking for. For example, find all ZIP Codes in Colorado, or all Census Tracts in Miami-Dade County, etc.
Next, add in variables by clicking on them and specify the conditions you are looking for. TIP: Any data variable in SimplyAnalytics can be a condition, and you are welcome to have dozens of conditions, so feel free to be as creative or as specific as you want!
Click Search, and voila! The far-right side of the workspace will display which locations meet your criteria. Check out the report we created below:
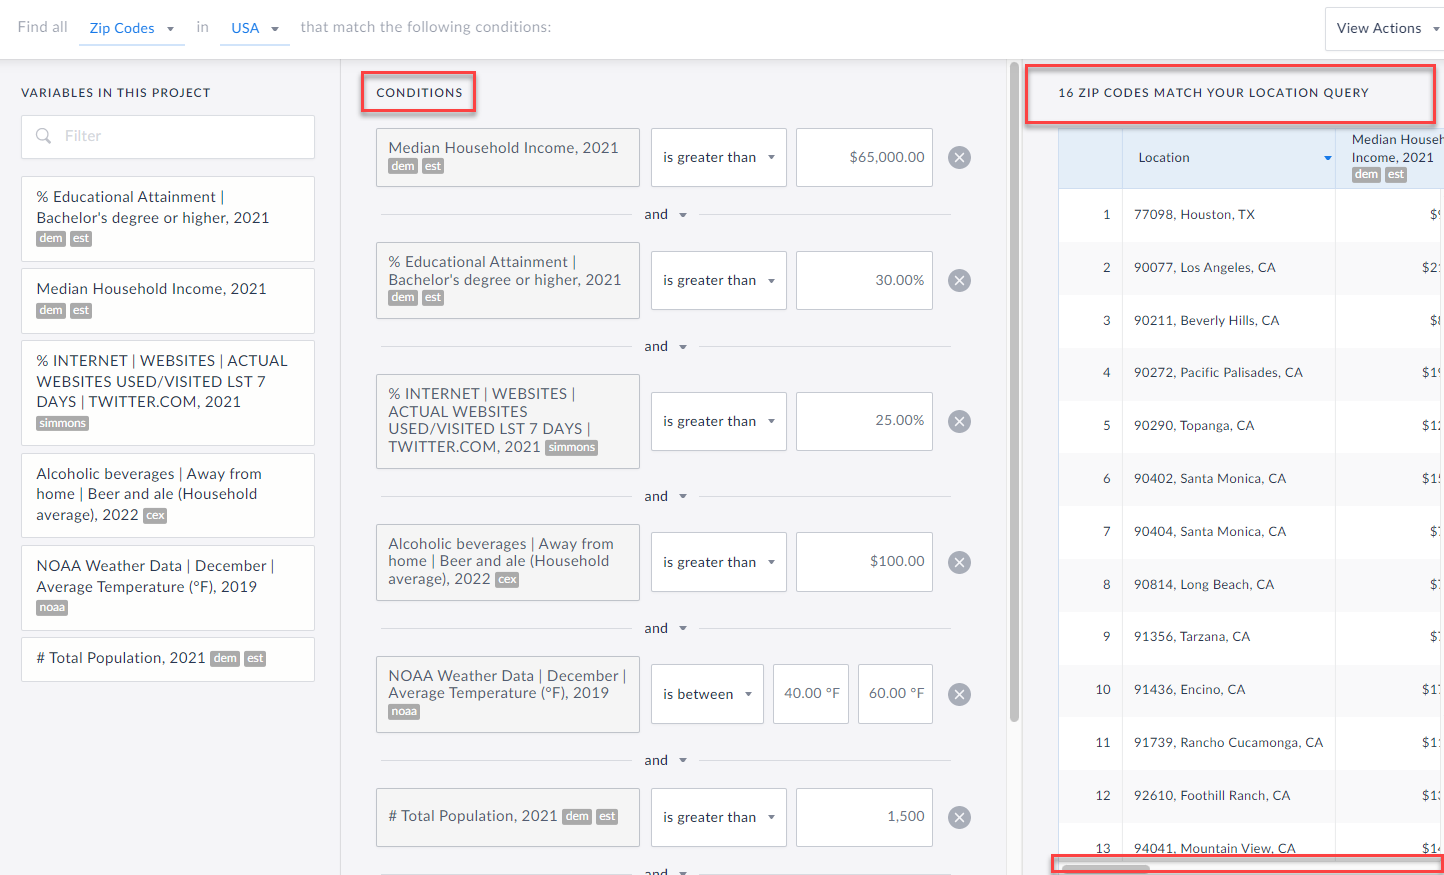 So, in case you were wondering - there are 16 ZIP Codes in the USA that:
Have a Median HH Income greater than $65,000
AND
The % of Adults 25+ with a Bachelor’s degree or higher is greater than 30%
AND
The % of adults who have been on Twitter in the past week is greater than 25%
AND
The Average HH spends more than $100 on Beer and Ale away from Home
AND
The Average Temperature in December is between 40 and 60 degrees
AND
The Zip Codes have a population of more than 1,500
This is sort of a silly example, but it does highlight what you are capable of doing with this report in SimplyAnalytics. Let us know any interesting queries you come up with!
More from SimplyAnalytics
Posted on Mar 18, 2015 by Admin
Can you guess which US city has the most residents per square mile? Today we’re going to use SimplyMap to answer this question for all cities, as well as cities with a population greater ...
Posted on Oct 24, 2019 by Admin
Hi everybody! This week we wanted to bring you something unique, so we’re taking you behind the scenes to show you what goes in to setting up the SimplyAnalytics conference booth you’ve c...
Posted on Aug 20, 2015 by Admin
Is there a specific age group and income bracket you are specifically interested in researching for a target location? Our Life Stages module has the information you need. Life Stages, by...
Posted on Sep 15, 2025 by Admin
SimplyAnalytics will be attending the upcoming NCLA Conference in Winston-Salem October 14-17!
Posted on Dec 06, 2009 by Admin
ALA's Choice Magazine, publisher of independent reviews of products and services for academic libraries, released a new review of SimplyMap in the December 2009 edition. The reviewer, Car...
Posted on Dec 11, 2015 by Admin
With the final week of the college football season in the books, and bowl game selections having just taken place, we wanted to search within SimplyMap to see if any data pertaining to co...
Posted on Jan 24, 2009 by Admin
Men's Health magazine took a look this month at where our wireless habits are most out of control. Their methodology includes the use of SimplyMap: First, we crunched data from SimplyMap...
Posted on Feb 24, 2019 by Admin
We will be exhibiting at SCELC* Vendor Day on March 14th. Visit us at table 510 and attend one of our two sessions demonstrating SimplyAnalytics. The presentations will highlight newly av...
Posted on Nov 03, 2017 by Admin
This week we’ll talk about one of our favorite features in SimplyAnalytics - the custom combination location. This feature is a simple and effective means to create custom geographies whe...
Posted on Dec 15, 2014 by Admin
Custom Locations allow SimplyMap users to combine several locations into one larger region. For example, you can use this feature to combine three adjacent ZIP Codes to create your study ...