


View Spotlight: Related Data Table
Posted on Jul 30, 2018 by Admin
Hello readers! Welcome to this week’s blog. This week we will feature the Related Data Table view and how you can use it to maximize your productivity in SimplyAnalytics.
What is it?
The Related Data Table View is designed to allow you to quickly add in many similar data variables at once. For example, if you add "% Households w/ Income $50,000 to $74,999" the report will also show all of the other income ranges as well.
Some other use cases: you want to quickly add in all life-stage data variables, or PRIZM psychographic segments, or all Language variables.
Example
Identify what the top PRIZM household segment is for a ZIP Code. The PRIZM Dataset is a marketing segmentation system that allows you to understand the demographic and lifestyle/consumer traits of any location in the United States. This data is very popular within marketing departments across many large companies, and we are happy to offer it as an add on module to your subscription.
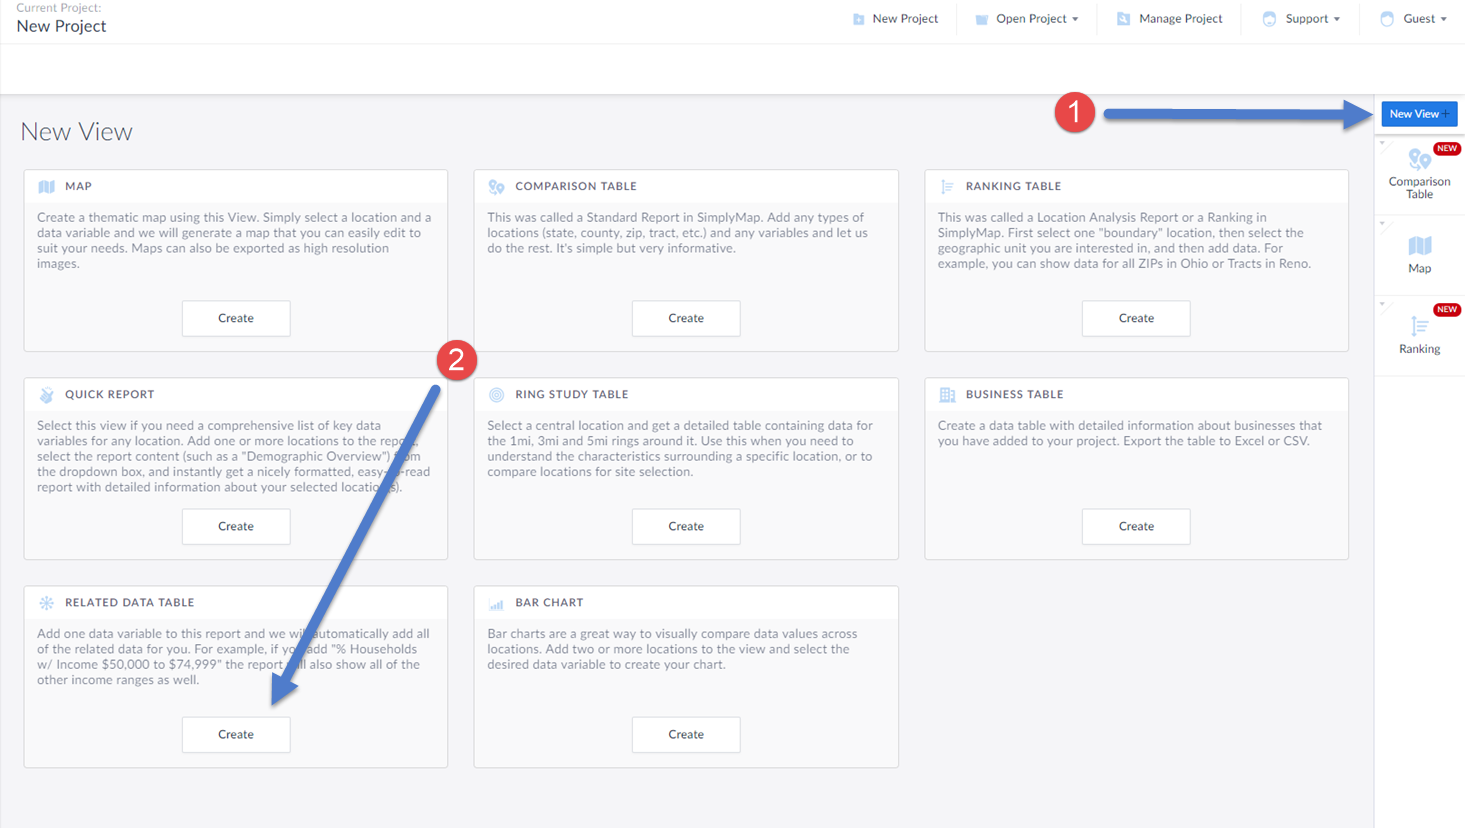
(1) Select New View from the top-right of the interface
(2) Click on the Create button under the Related Data Table section
This will open up the Edit Related Data Table screen. This is where you add in your location, and data variable. In this example, we will select a random PRIZM Premier segment. Keep in mind, this report will add in all of the segments for you.
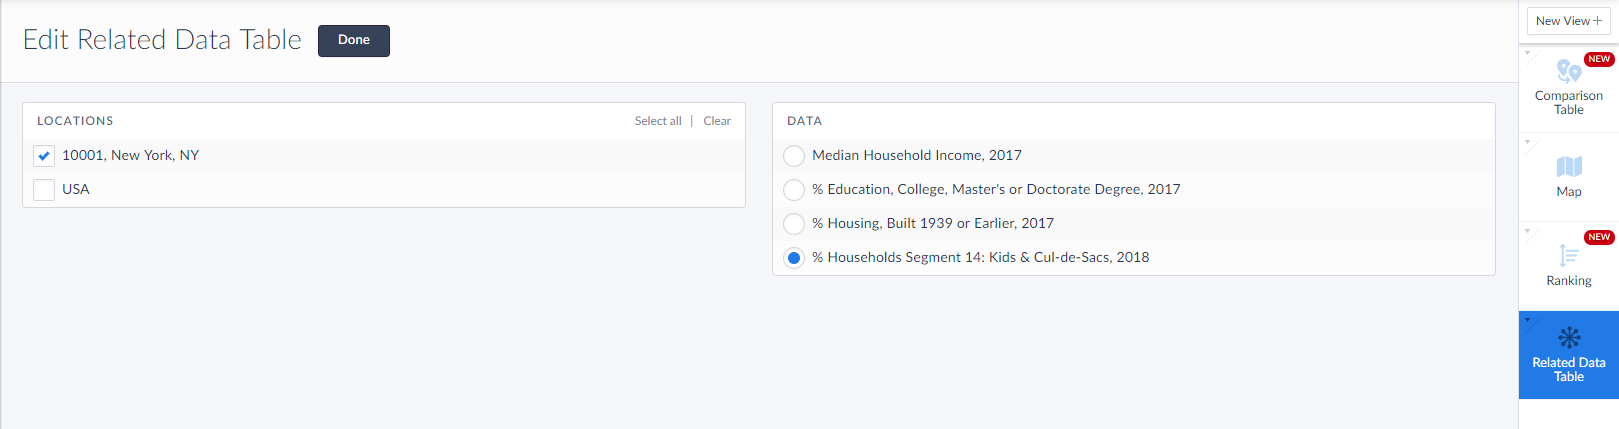
Select Done once the location and data variable have been added, and the report will generate.
Click on the Location/column header to sort either Ascending or Descending. It looks like the ZIP Code 10001 in New York is largely classified as Connected Bohemians.
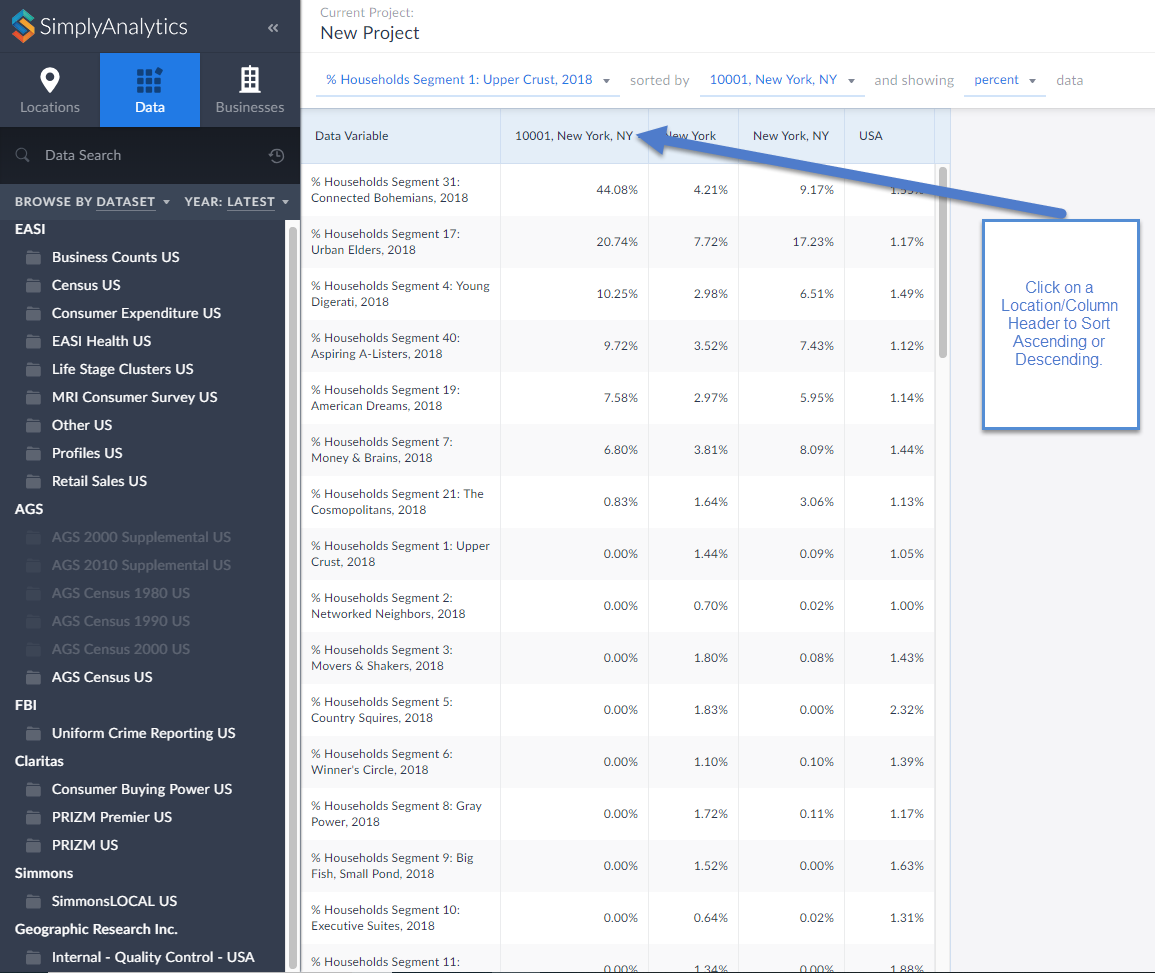
Click on the variable title to view the Metadata and learn more about this segment.
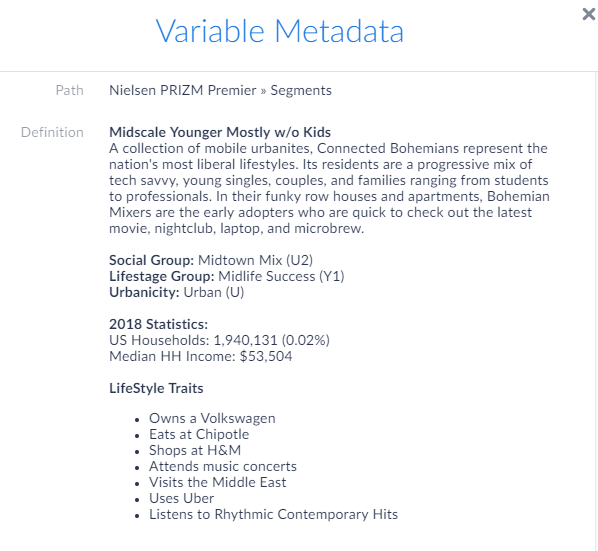
Interesting stuff! If your organization is interested in having a trial or webinar of the PRIZM dataset featured here, feel free to reach out to: support@simplyanalytics.com
More from SimplyAnalytics
Posted on Feb 23, 2012 by Admin
Geographic Research, Inc. will be exhibiting at the Public Library Association (PLA) Conference. Visit us at Booth 2329 to learn more about SimplyMap and enter our raffle for a new com...
Posted on Feb 05, 2015 by Admin
In this week’s edition of exploring SimplyMap data, we take a look at America’s coffee drinkers. SimplyMap contains more than 100 coffee related variables, including consumer spending on ...
Posted on Nov 06, 2014 by Admin
With over 75,000 variables in SimplyMap, you can find virtually any information you want. This week, we take a look at which U.S. locations spend the most money eating at restaurants or c...
Posted on May 03, 2011 by Admin
The GRI team is very excited to announce the launch of SimplyMap 2.0! Completely redesigned, it is now easier than ever to access data and create professional quality thematic maps and re...
Posted on Jun 21, 2022 by Admin
Hello readers! We hope you’re having a great day. Today we are featuring 5 commonly asked questions about the American Community Survey dataset that’s available to all customers in Simply...
Posted on Feb 27, 2009 by Admin
Geographic Research, Inc. is pleased to participate in the Statewide California Electronic Library Consortium's (SCELC) 12th Annual Vendor Day. SCELC members and librarians from other aca...
Posted on Jan 23, 2024 by Admin
We are excited to again make the trip to Los Angeles for SCELCapalooza 2024 hosted at Loyola Marymount University! Please drop by our table on Wednesday, Feb. 28th to learn more about Sim...
Posted on Dec 11, 2023 by Admin
Hello readers! We have some fantastic news to share. SimplyAnalytics is thrilled to announce the addition of 2020 Election data to our expanding collection of powerful datasets. With this...
Posted on May 28, 2009 by Admin
The Charleston Advisor, which publishes critical reviews of online resources for libraries, published a review of SimplyMap in April. We are very pleased to have received 4 1/4 stars out...
Posted on Feb 27, 2015 by Admin
SimplyMap is an excellent tool for market research, and it’s made even more powerful by Nielsen PRIZM data. Nielsen PRIZM is the highest quality market segment data available. Every house...