


View Spotlight - Time Series Table
Posted on Aug 27, 2018 by Admin
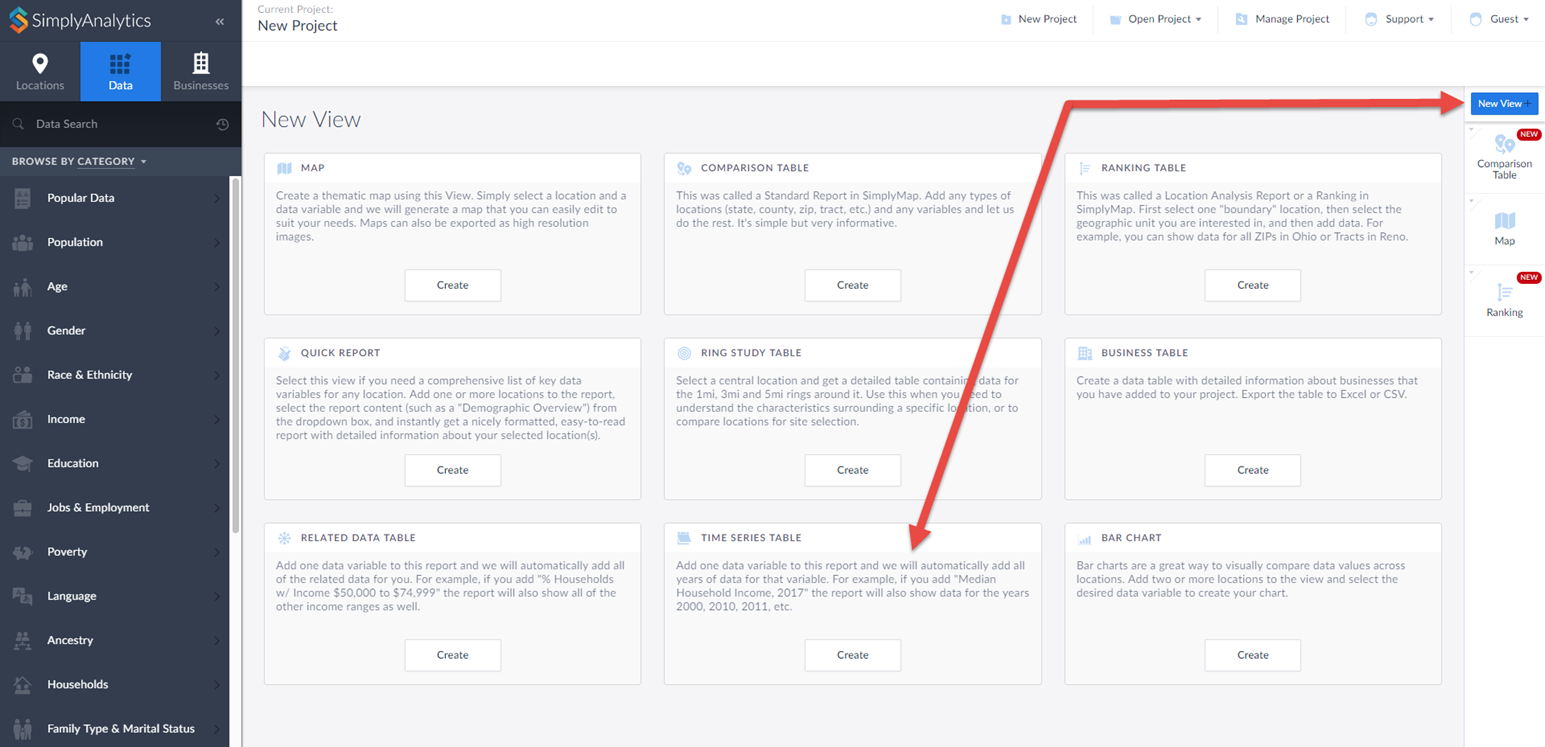
Welcome readers! This week we are excited to feature our newest view in SimplyAnalytics, the Time Series Table.What is it?The Time Series Table allows you to quickly pull all years available for a variable of your choosing. This allows you to easily identify trends over time.ExampleYou want to track the trend of median household income across some target locations.In your project, select New View towards the top-right of your screen and select Time Series Table.
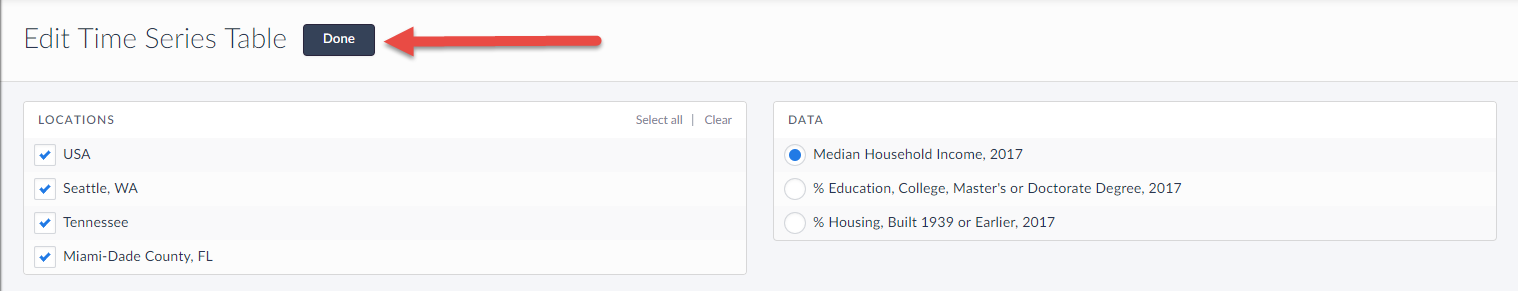
This opens up the Edit View screen. Specify Median Household Income and the locations you want to view the trends for. Click on Done to generate your table.
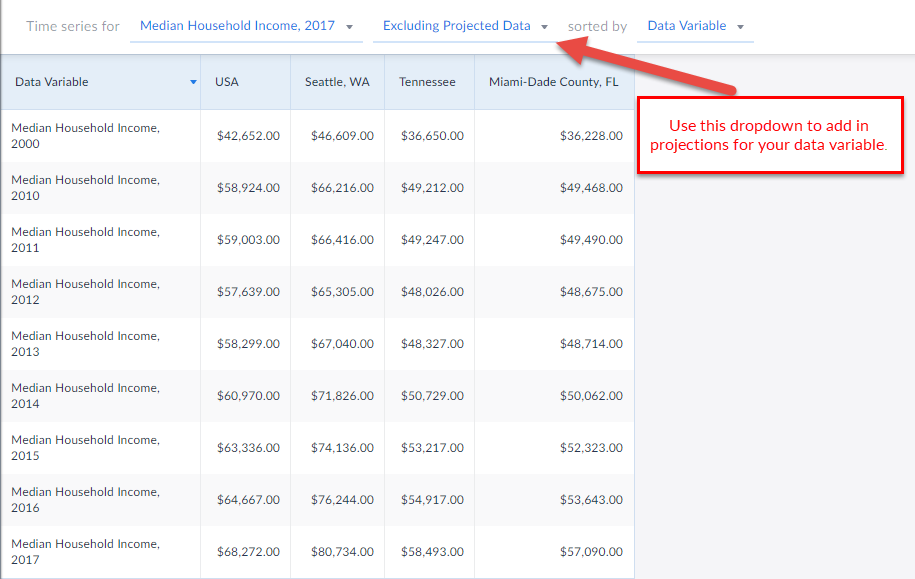
 And that’s all there is to it! You can use the dropdowns to change variables or add in projections for that data variable.
 We hope you’re as excited as we are about this new view - let us know if you have any questions or suggestions for future features or blogs.
More from SimplyAnalytics
Posted on Jan 08, 2018 by Admin
The SimplyAnalytics team will be exhibiting at ALA Midwinter in Denver February 9-12. Stop by booth 2152 for a visit and a tour of SimplyAnalytics, the best-in-class analytics and data vi...
Posted on Oct 22, 2008 by Admin
Excerpt from University of Iowa Library blog: In your marketing class, you may be developing a marketing plan for a pre-made meals restaurant specializing in vegetarian menus in Chicagola...
Posted on Apr 01, 2014 by Admin
Another fantastic series of workshops and events are planned at the SLA Conference on June 8-10th, 2014. Register now for networking and workshops throughout the week. Over 200 events are...
Posted on Dec 19, 2016 by Admin
Stop by the Geographic Research booth [#T8] at the Ontario Library Association Super Conference to get a hands-on look at our latest and greatest SimplyMap offering. The conference will t...
Posted on Oct 07, 2013 by Admin
Do you know the quickest way to find the name of a Block Group, Census Tract or ZIP code in our upcoming release for 3.0? The i-Tool gives you the ability to click anywhere on a map to g...
Posted on Feb 16, 2009 by Admin
Men's Health conducted their first survey of America's recycling habits, and used SimplyMap in their research. Here’s how the editors explain their methodology: To determine how well citi...
Posted on Jan 24, 2009 by Admin
Men's Health magazine took a look this month at where our wireless habits are most out of control. Their methodology includes the use of SimplyMap: First, we crunched data from SimplyMap...
Posted on Dec 03, 2012 by Admin
Come visit the Geographic Research booth at the Ontario Library Association Super Conference this season. The conference will take place on January 30 - February 2, 2013 at the Metro Toro...
Posted on May 17, 2016 by Admin
This week’s SimplyMap report is a quick reader challenge. Can you guess what the map of the United States below is depicting? Keep in mind the legend colors - lighter is less, and darker ...
Posted on Apr 21, 2015 by Admin
In this week’s edition of exploring SimplyMap data, we spotlight the Consumer Buying Power® data package in SimplyMap. What is it? The Nielsen Consumer Buying Power® database incorporates...