 Go up


University of Iowa Libraries: Add Informative Maps to Your Presentations
Posted on Oct 22, 2008 by Admin
Excerpt from University of Iowa Library blog:
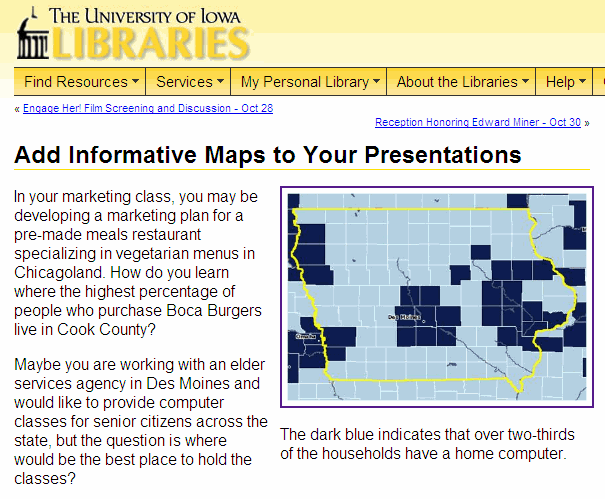
In your marketing class, you may be developing a marketing plan for a pre-made meals restaurant specializing in vegetarian menus in Chicagoland. How do you learn where the highest percentage of people who purchase Boca Burgers live in Cook County?
Maybe you are working with an elder services agency in Des Moines and would like to provide computer classes for senior citizens across the state, but the question is where would be the best place to hold the classes?
The answer is in SimplyMap. SimplyMap is a web-based mapping application that lets you quickly create professional-quality thematic maps and reports, using the thousands of US demographic, business and marketing data variables.
More from SimplyAnalytics


Posted on Dec 07, 2021 by Admin
Hello readers! We hope you are enjoying the holiday season as much as we are. Today, we are happy to announce a couple of improvements to SimplyAnalytics designed to help you get your res...
Posted on Mar 14, 2010 by Admin
The GRI team was honored to learn that SimplyMap was included in this year's Choice Outstanding Academic Title List, published in the January 2010 issue of Choice Magazine. This is a grea...
Posted on Feb 14, 2017 by Admin
In previous blog entries, we highlighted the value of having a mapping application to complement premium data when analyzing America's geographic preferences in credit cards, and mayonnai...
Posted on Jan 18, 2008 by Admin
The BRASS Business Reference Sources Committee of Reference & User Services Quarterly (RUSA) selected SimplyMap as one of the Outstanding Business Reference Sources for 2007. Excerpt...
Posted on Aug 15, 2013 by Admin
Anyone who has traveled to Seattle hoping for a sunny day could fairly estimate that it is one of the rainiest states with the highest level of precipitation each year. SimmonsLOCAL varia...
Posted on Mar 18, 2015 by Admin
Can you guess which US city has the most residents per square mile? Today we’re going to use SimplyMap to answer this question for all cities, as well as cities with a population greater ...
Posted on Nov 20, 2015 by Admin
In a previous blog we demonstrated the power of utilizing multiple years for the same variable. We found that the usage of Amazon.com had grown substationally from 2008-2014. In this week...
Posted on May 17, 2016 by Admin
This week’s SimplyMap report is a quick reader challenge. Can you guess what the map of the United States below is depicting? Keep in mind the legend colors - lighter is less, and darker ...
Posted on Jun 09, 2021 by Admin
Hello (virtual) ALA attendees! Thank you for dropping by our booth to learn more about SimplyAnalytics. Please email us if you have any questions or would like a live demo or free 30 day ...
Posted on May 10, 2016 by Admin
One benefit of data and applications like SimplyMap is the ability to visualize information. In this week’s report, we’ll take a quick look at some branding preferences in contiguous Amer...