


Exploring SimplyMap Data: Life Stage Clusters
Posted on Aug 20, 2015 by Admin
Is there a specific age group and income bracket you are specifically interested in researching for a target location? Our Life Stages module has the information you need. Life Stages, by EASI is a premium data set available for trial or purchase to all SimplyMap subscribers. In this brief write up, we’ll take a look at some of the options available within this data package.
The Life Stages module is broken down into three folders:
Young Households - Very Young <25 and Young 25-34
Middle Age Households - Middle Age 35-44 and Late Middle Age 45-54
Older Households - Nearly Senior 55-64, Senior 65-74 and Oldest 75+
Each of these folders is further broken down by family types and income.The income data has three tiers: lower income, moderate income and higher income. Let’s get started with a demonstration.
Scenario: You want to analyze the city of Chicago by Life Stage clusters to identify high income, non-family households (young, middle age and older).
Step 1: Create a Location Analysis Report, and use the city of Chicago as your location.
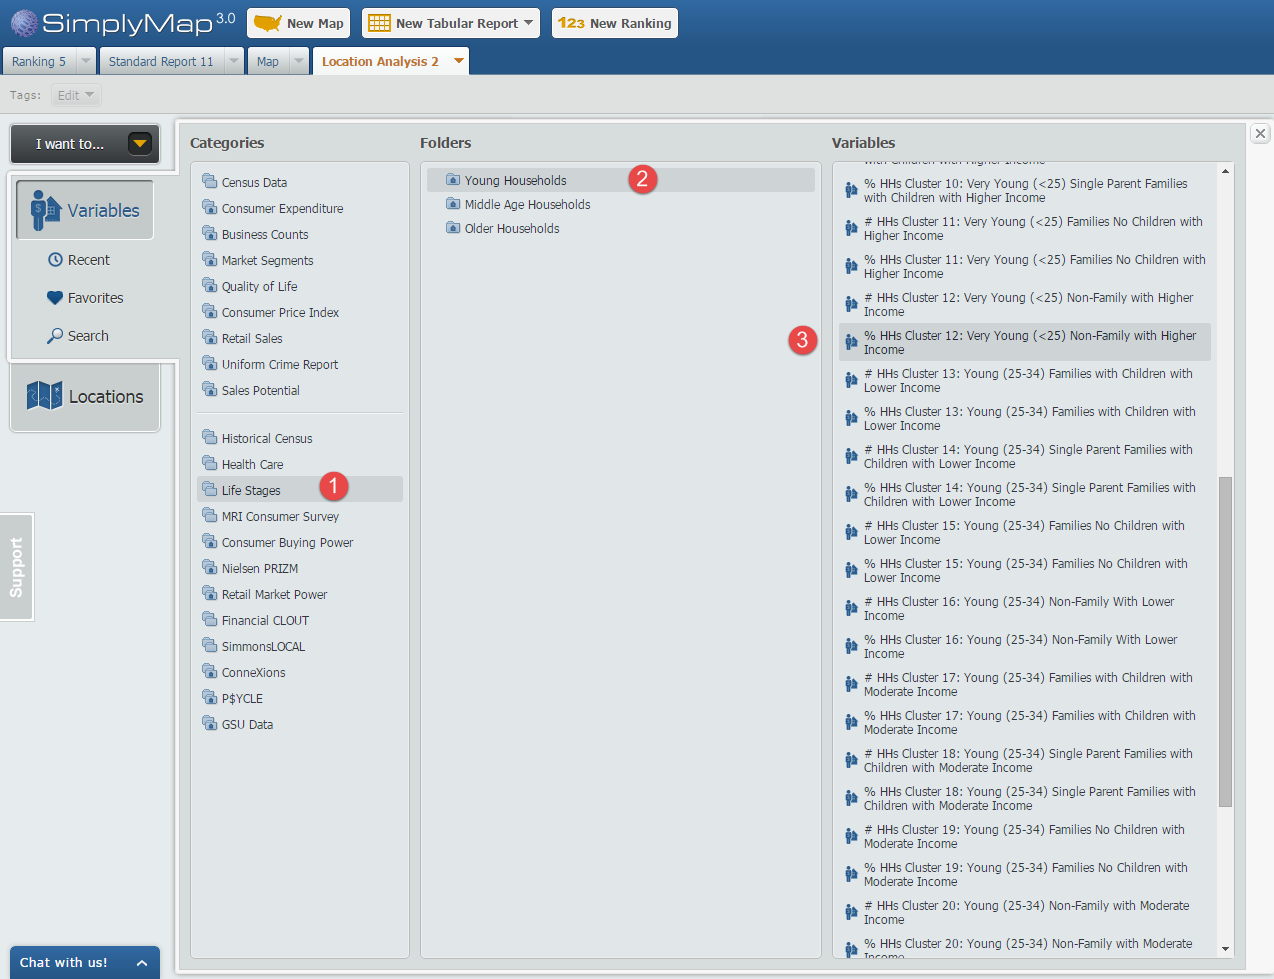
Step 2: Open the Variables Panel and navigate to Life Stages and through each household folder, selecting the variables that meet our criteria, such as: % HHs Cluster 12: Very Young (<25) Non-Family with Higher Income, 2014. Image below for reference.
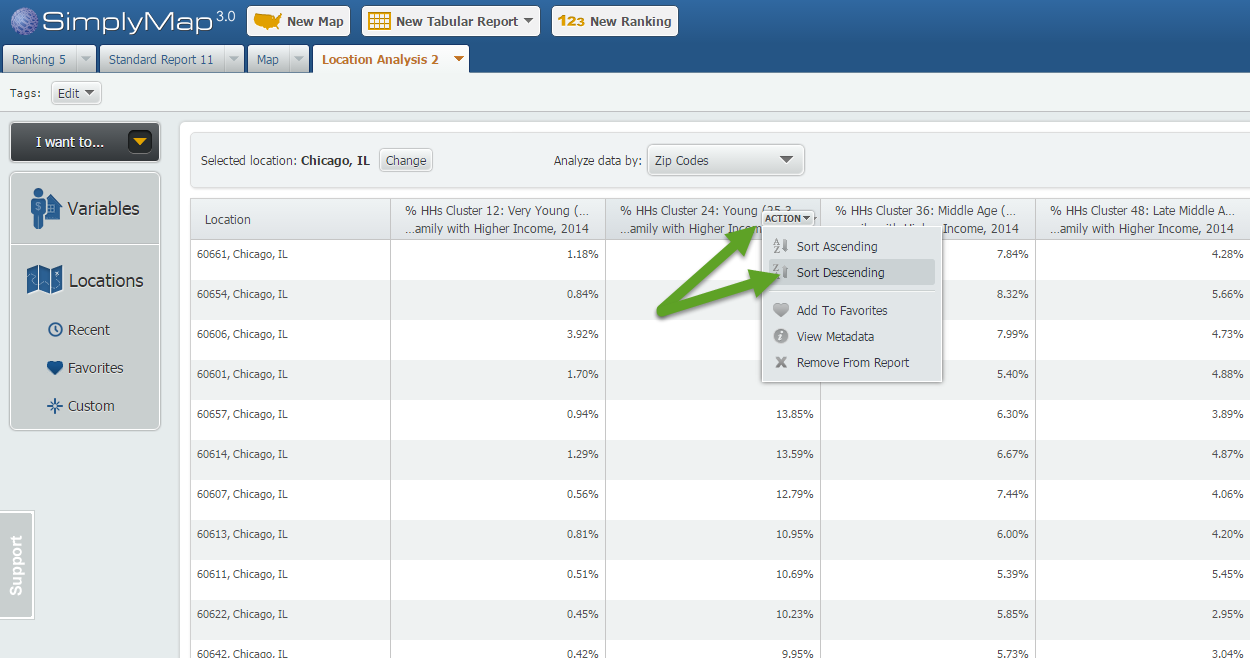
Step 3: Hover over each variable in your report and select “Sort Descending”. This will effectively rank your Chicago ZIP Codes by that variable allowing you to see the ZIP Codes where each selected variable is most represented.
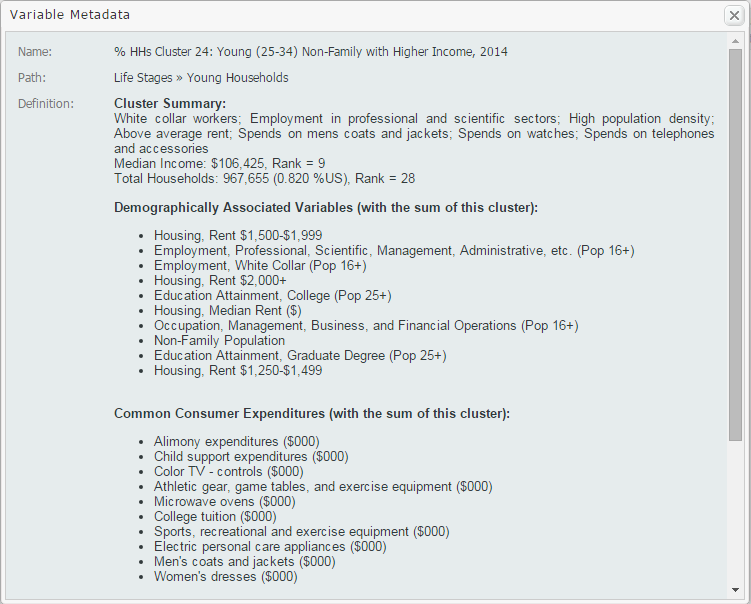
Tip: To gather more information on your variables, such as a definition and summary, select View Metadata from the dropdown that appears when hovering over the variable. Sample shown below:
We hope you enjoyed this week’s feature on the Life Stages data module. If you feel this data package could be useful at your institution, send an email to support@geographicresearch.com We would be happy to set up a free temporary trial.
Stay tuned for more!
More from SimplyAnalytics
Posted on May 15, 2015 by Admin
In this week’s SimplyMap report, we want to share with you the many options available when exporting maps in SimplyMap. In SimplyMap, when a user selects Export Map Image from the Actions...
Posted on Nov 03, 2017 by Admin
This week we’ll talk about one of our favorite features in SimplyAnalytics - the custom combination location. This feature is a simple and effective means to create custom geographies whe...
Posted on May 26, 2020 by Admin
Hello readers! We hope you are doing well, and thank you for your continued support of SimplyAnalytics. We are excited to announce that scatterplots are officially live! Scatter plots ar...
Posted on May 23, 2019 by Admin
Come visit the SimplyAnalytics team at the Special Library Association's Annual Conference in Cleveland. Special librarians and other information professionals come together at SLA’s annu...
Posted on Oct 08, 2019 by Admin
Hello readers! This week’s “From the Help Desk” is short & sweet. Let’s get to it! Question: How do I analyze all of the states at once in a report? Answer: The Ranking Report allows ...
Posted on Feb 19, 2016 by Admin
Drop by booth #857 at PLA 2016 to meet the SimplyMap team and learn more about the features and functions behind SimplyMap. Have a Ghirardelli Chocolate while we present SimplyMap and off...
Posted on Nov 28, 2023 by Admin
Hello readers! We are happy to announce that SimplyAnalytics has successfully migrated to the Census 2020 boundaries on Sunday, November 19th. This blog will talk about what that is, what...
Posted on Nov 19, 2019 by Admin
Hello readers! Today we are bringing you a new blog entry inspired by a recent Help Desk question. If you ever have any questions about SimplyAnalytics, please do not hesitate to reach ou...
Posted on May 25, 2010 by Admin
The American Library Association 2010 Annual Conference is coming and the GRI team is gearing up for another great event this summer. We will be in Washington, D.C. again this year, June ...
Posted on May 03, 2011 by Admin
The GRI team is very excited to announce the launch of SimplyMap 2.0! Completely redesigned, it is now easier than ever to access data and create professional quality thematic maps and re...