


SimplyMap Tip: Using Multiple Years
Posted on Jul 30, 2015 by Admin
One great feature within SimplyMap is the ability to track the same variable across multiple years. In this report, we will track the percentage of households in the US ordering items from Amazon.com, as we suspect it might show a marked increase over the span of the available years. The value in viewing the same variable over multiple years is that it helps users identify trends in the data over time.
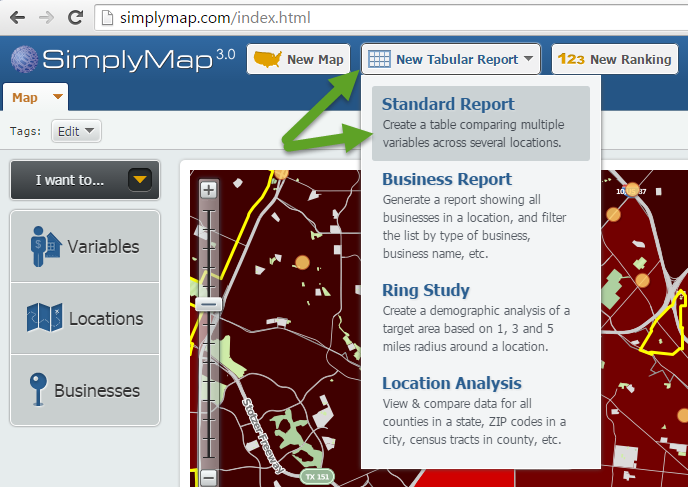
Let’s get started. First, create a Standard Report by selecting New Tabular Report > Standard Report at the top of your screen.
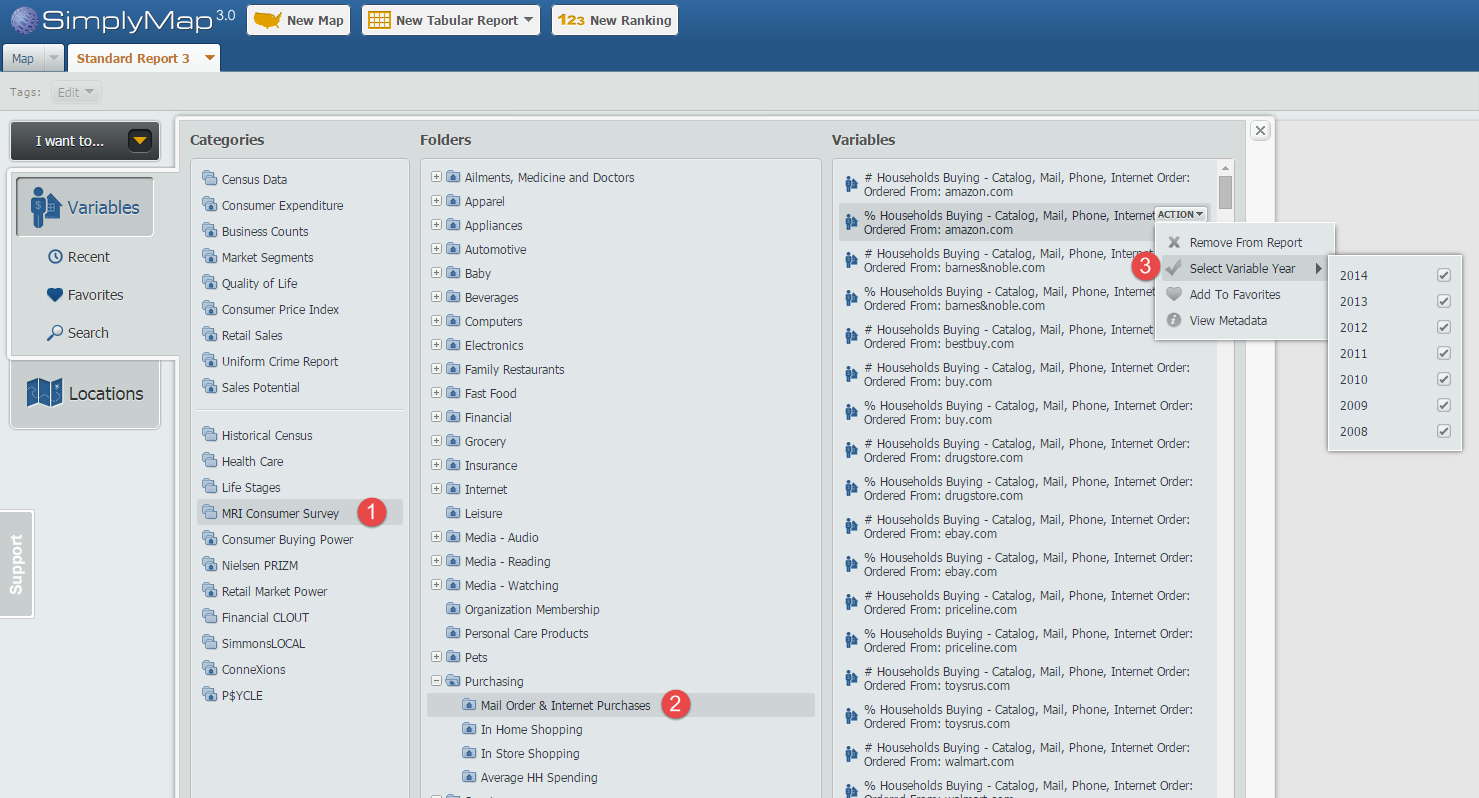
Next, navigate through this path: MRI Consumer Survey » Purchasing » Mail Order & Internet Purchases and hover over the variable, % Households Buying - Catalog, Mail, Phone, Internet Order: Ordered From: amazon.com, 2014 so the actions menu appears. From the “Select Variable Year” option check off the list of years you would like to see. In this example we will use 2008-2014. See the image below for reference:
Close out the variables panel, and your Standard Report will be created using the United States by default. Results below!
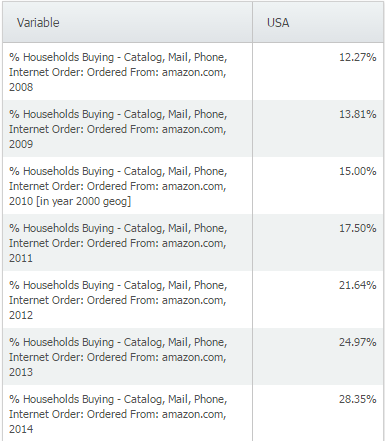
The data clearly shows a trend in Amazon.com ordering throughout years, more than doubling from 2008 to 2014 nationally. We suspected this at the onset, and the data appears to back up our initial thoughts. Feel free to add any additional geographies you’d like to see - the data is available down to the block group level.
There are over 200 variables available within the Mail Order & Internet Purchases folder in the MRI Consumer Survey data, including other websites such as:
ebay.com
buy.com
priceline.com
bestbuy.com
walmart.com
And purchases by catalog/mail order from:
QVC
L.L. Bean
Macy’s
Nordstrom
We encourage you to explore the many variables found within the MRI data package. If your school or library does not currently subscribe to the MRI data set, please write in to support@geographicresearch.com. We are always happy to provide demonstrations and trials of data packages at no cost.
What other trends have you utilized SimplyMap to identify? Let us know in the comments below!
More from SimplyAnalytics
Posted on Sep 27, 2019 by Admin
Hello readers! This week we provide an in-depth response to a question asking about the legend classification methods in SimplyAnalytics. This response is now part of our Help Center: htt...
Posted on Jun 09, 2021 by Admin
Hello (virtual) ALA attendees! Thank you for dropping by our booth to learn more about SimplyAnalytics. Please email us if you have any questions or would like a live demo or free 30 day ...
Posted on Nov 28, 2023 by Admin
Hello readers! We are happy to announce that SimplyAnalytics has successfully migrated to the Census 2020 boundaries on Sunday, November 19th. This blog will talk about what that is, what...
Posted on May 25, 2010 by Admin
The American Library Association 2010 Annual Conference is coming and the GRI team is gearing up for another great event this summer. We will be in Washington, D.C. again this year, June ...
Posted on Sep 07, 2011 by Admin
Geographic Research will be exhibiting and presenting during a vendor showcase session at the upcoming North Carolina Library Association (NCLA) Biennial Conference, October 4-7, 2011 in ...
Posted on Jan 18, 2009 by Admin
Michigan State University is offering their users a basic introduction to using SimplyMap. The 1.5 hour session will cover the basics of how to use SimplyMap to create maps and reports u...
Posted on Aug 30, 2009 by Admin
Jeff Zaslow, Wall Street Journal columnist and co-author of the The Last Lecture, will speak at the Orlando, FL Public Library on Friday, September 11 at 7 p.m. Zaslow helped the late Ran...
Posted on Jan 28, 2010 by Admin
Come visit the Geographic Research booth at the Ontario Library Association Super Conference, February 24-27, 2010 at the Metro Toronto Convention Centre. The Ontario Library Association ...
Posted on Mar 22, 2016 by Admin
Inspired by some recent support desk questions, this week’s SimplyMap report will provide some useful tips and tricks to help make the most out of your maps. Let’s get started! First, let...
Posted on Aug 26, 2015 by Admin
Most people in the United States could probably guess which cities are popular amongst tourists - Los Angeles and New York. But can you guess how much money is spent in novelty and souven...