


Exploring SimplyMap Data: Using the Internet to Make Phone Calls
Posted on Sep 08, 2016 by Admin
One of our favorite uses of SimplyMap is to find data that validates our general assumptions and observations. For example, in a previous blog we wrote about the growth of tablet ownership in the US and how the iPad dominates that area. It’s one thing to “know” that tablet ownership has grown, but it’s another thing to view the supporting data behind it.
This week, let’s explore another variable we presume has markedly increased in recent years - the % of Households who used the internet to make a phone call. Let’s get started!
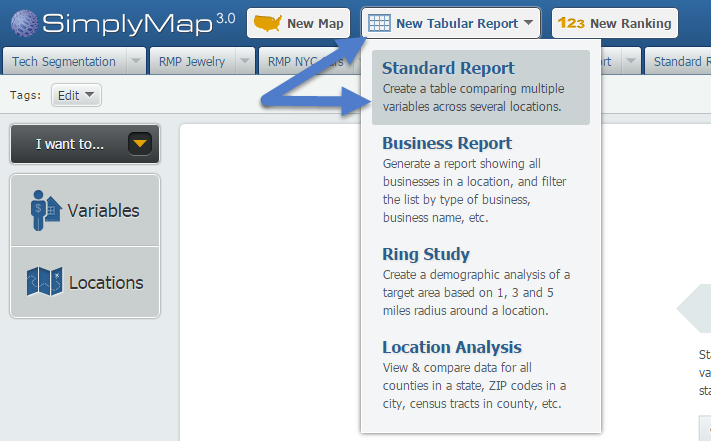
Open up a Standard Report via the New Tabular Report button at the top of SimplyMap:
Navigate through this path: MRI Consumer Survey » Internet » Internet Access and Activities to find the variable, % Households Using - Internet Activities: Made a phone call, 2015.
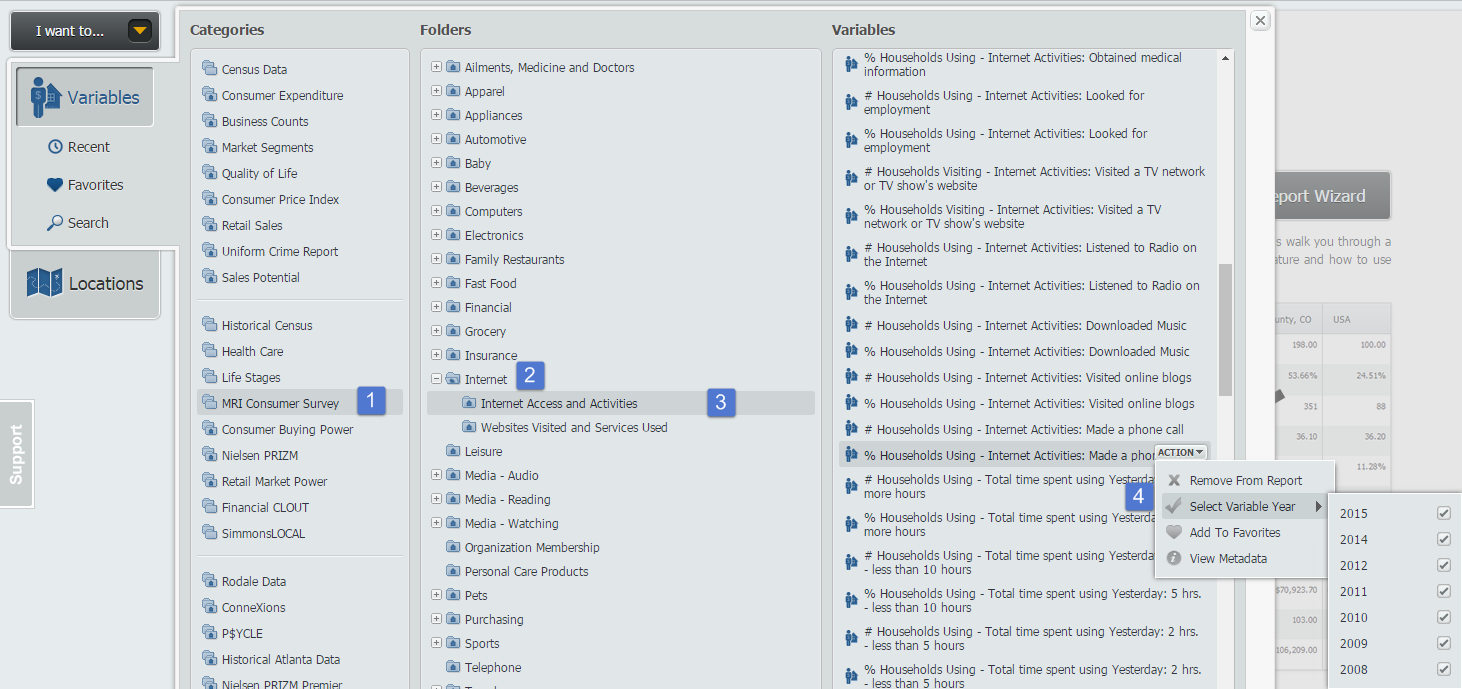
Hover over the Action menu on the variable and select the available years from the Select Variable Year option, shown above.
Close out the Variables panel to generate your report. Results below!
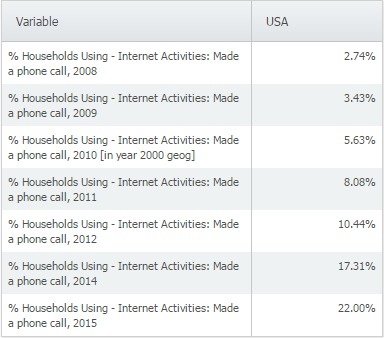
It looks like using the internet to make a phone call has exploded in recent years, from 2.7% in 2008 to 22% in 2015. Why do you think this is? Aside from the availability of the internet in general, it could be due to the rise in tablets, FaceTime and Skype.
Stay tuned for more in this series, and let us know if there’s anything within SimplyMap you’d like to see written about!
More from SimplyAnalytics
Posted on Nov 24, 2014 by Admin
In this week’s report, we research America’s most educated cities. SimplyMap contains a total of 111 educational attainment variables, including general population and by race. We used th...
Posted on May 06, 2016 by Admin
Visit us at booth #775 at the ALA 2016 annual conference to meet the SimplyMap team and learn more about the features and functions behind SimplyMap. Have a Ghirardelli Chocolate while we...
Posted on May 24, 2023 by Admin
SimplyAnalytics is excited to attend. Swing by booth 1733 for a brief demo, and discover how our user-friendly demographics, business, health & marketing data analytics and visualizat...
Posted on Feb 13, 2015 by Admin
In this week’s report exploring SimplyMap data, we want to find out where America’s remote workers reside. To find this, we can tap into the Census data in SimplyMap. The specific variabl...
Posted on Dec 02, 2014 by Admin
Today we take a look at one of the more advanced features in SimplyMap - editing the map legend. Editing the map legend is a great way to not only customize how the data is distributed on...
Posted on Jul 22, 2015 by Admin
In this week’s SimplyMap report, we take a look at one of our newly available data packages - ConneXions® from Nielsen. The ConneXions® segmentation system integrates consumer behavior an...
Posted on Jan 18, 2009 by Admin
Michigan State University is offering their users a basic introduction to using SimplyMap. The 1.5 hour session will cover the basics of how to use SimplyMap to create maps and reports u...
Posted on Aug 15, 2013 by Admin
Anyone who has traveled to Seattle hoping for a sunny day could fairly estimate that it is one of the rainiest states with the highest level of precipitation each year. SimmonsLOCAL varia...
Posted on Jan 28, 2010 by Admin
Come visit the Geographic Research booth at the Ontario Library Association Super Conference, February 24-27, 2010 at the Metro Toronto Convention Centre. The Ontario Library Association ...
Posted on May 10, 2016 by Admin
One benefit of data and applications like SimplyMap is the ability to visualize information. In this week’s report, we’ll take a quick look at some branding preferences in contiguous Amer...