


Feature Spotlight: Custom Combination Location
Posted on Nov 03, 2017 by Admin
This week we’ll talk about one of our favorite features in SimplyAnalytics - the custom combination location. This feature is a simple and effective means to create custom geographies where you’re able to specify the exact makeup for. Let’s jump in.
Why would I want to use this feature?
Sometimes you may want to study a neighborhood in your city, or area that you know of that isn’t necessarily a formal geography itself. One of the common questions we get asked is, “How do I get data for “my neighborhood” or “downtown”?” and that’s a fair question - the problem is, “my neighborhood” or “downtown” is not a formal Census geography, but it’s probably a combination of a few CTs or ZIP Codes. That’s where the Custom Combination Location feature comes into play.
How to Use It:
In this example, we’re going to make the Greenwich Village and Soho neighborhoods in Manhattan.
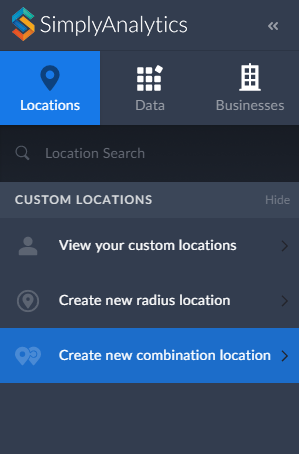
1. Click on Create New Combination Location found within the Locations tab towards the left of the screen.
2. Give your location a name.
3. Enter in the locations that comprise your target area - in this case, the Greenwich Village and Soho neighborhoods consist of ZIP Codes: 10012, 10013 and 10014.
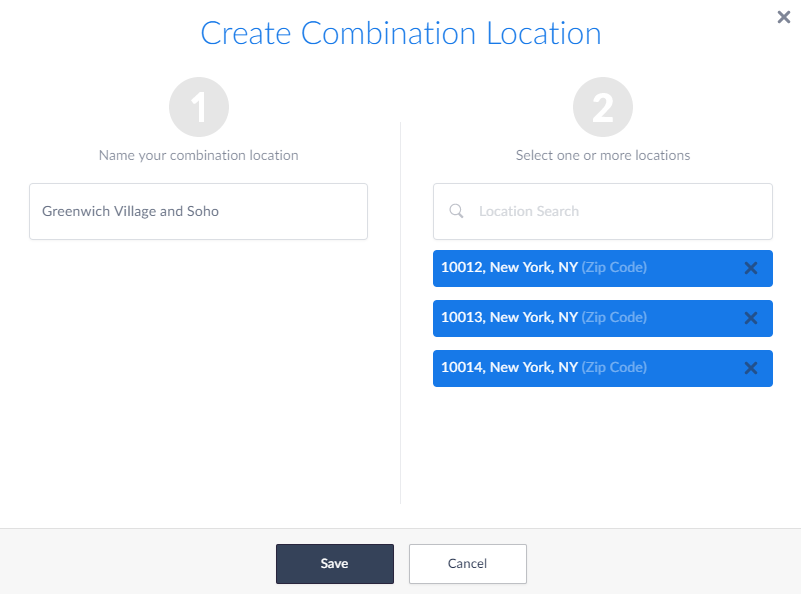
4. Select Save
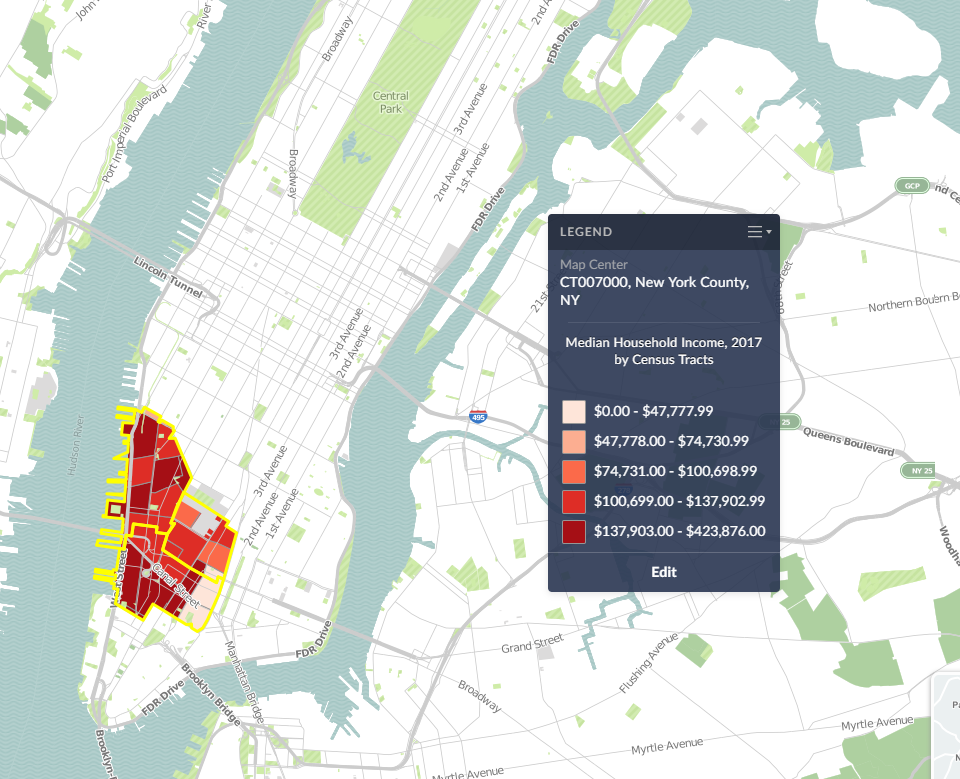
Use your Location:
Now that your custom location is saved, you are free to use it in Maps and reports. Your custom location will be stored within the View your Custom Locations option in the Locations tab.
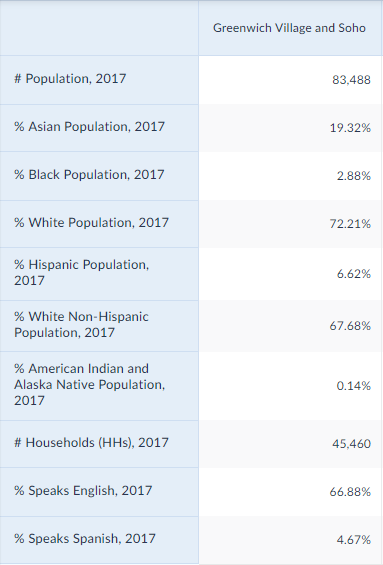
SimplyAnalytics will calculate the #, % and Average variables for you in reports:
And that’s it for today! In a future post, we’ll talk about creating combination locations from your recently used and favorite locations.
More from SimplyAnalytics
Posted on Dec 15, 2014 by Admin
Stop by the Geographic Research booth at the Ontario Library Association Super Conference to check out SimplyMap Canada. The conference will take place January 28-31 at the Metro Toronto ...
Posted on Oct 12, 2010 by Admin
NC LIVE, a member-driven library service organization dedicated to providing online information services that support education, enhance statewide economic development, and increase qu...
Posted on May 06, 2016 by Admin
Visit us at booth #775 at the ALA 2016 annual conference to meet the SimplyMap team and learn more about the features and functions behind SimplyMap. Have a Ghirardelli Chocolate while we...
Posted on Jul 19, 2016 by Admin
Are you a tech wizard? Maybe you’re an apprentice? Learn more about technology consumption behaviors using the Simmons MOSAIC Technology Adoption segments located within the SimmonsLOCAL ...
Posted on May 06, 2013 by Admin
The GRI team is looking forward to exhibiting at SLA 2013 at the San Diego Convention Center, June 9th through the 11th. The Special Libraries Association (SLA) is a nonprofit global orga...
Posted on Dec 19, 2016 by Admin
Stop by the Geographic Research booth [#T8] at the Ontario Library Association Super Conference to get a hands-on look at our latest and greatest SimplyMap offering. The conference will t...
Posted on Aug 27, 2018 by Admin
Welcome readers! This week we are excited to feature our newest view in SimplyAnalytics, the Time Series Table.What is it?The Time Series Table allows you to quickly pull all years availa...
Posted on Nov 10, 2017 by Admin
Welcome to this week’s SimplyAnalytics blog post. Today we’re going to take a closer look at the options available to you when editing the map legend. Let’s get started! First, to start e...
Posted on Nov 06, 2019 by Admin
Hello readers! We hope you’re having a wonderful week. Today we feature another entry from our From the Help Desk series. Let’s get started! Question: How do I analyze data for downtown? ...
Posted on Dec 11, 2023 by Admin
Hello readers! We have some fantastic news to share. SimplyAnalytics is thrilled to announce the addition of 2020 Election data to our expanding collection of powerful datasets. With this...