


SimplyMap Tip: Creating a Custom Location
Posted on Dec 15, 2014 by Admin
Custom Locations allow SimplyMap users to combine several locations into one larger region. For example, you can use this feature to combine three adjacent ZIP Codes to create your study area.
In this example, we will take a look at neighborhoods (at the block group level) surrounding a university in Chicago.
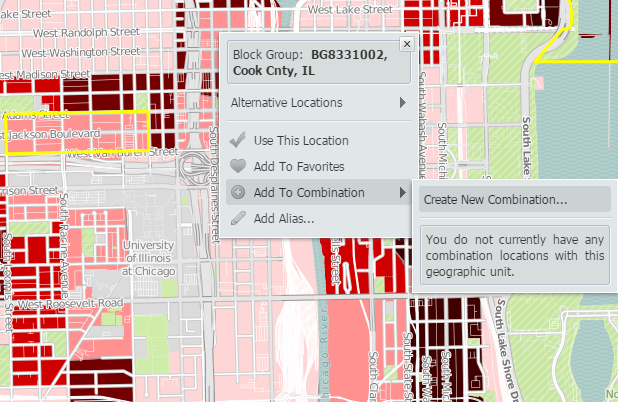
To get started creating your custom location from the map, use the i-tool and select a location. There will be a drop down to “Add to Combination” with an option to “Create New Combination”.
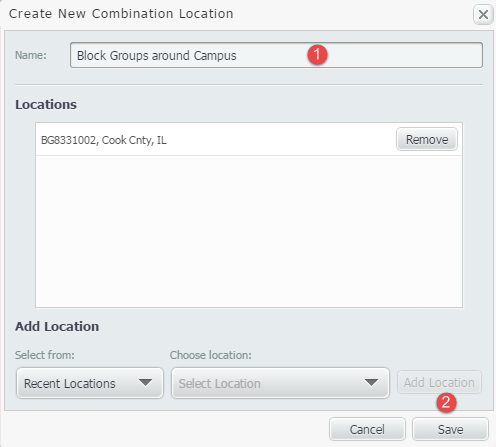
This will open up a box to create your combination. Enter a name, and Save.
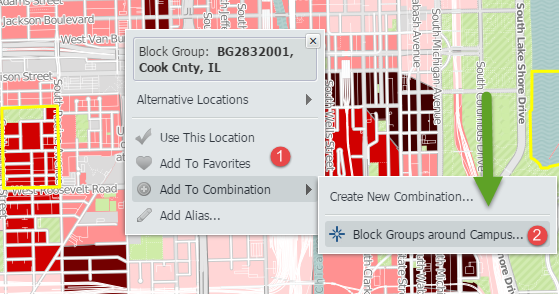
Once saved, your combination location will be available to have additional locations added to it. To add more locations, use the i-tool over a location once more, and select “Add to Combination” while choosing the combination that was just created.
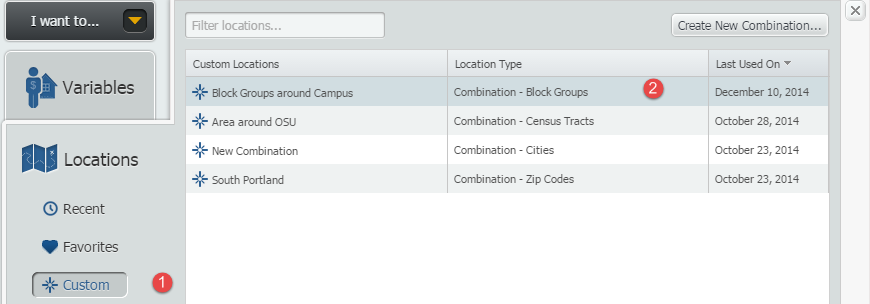
Repeat this process with all locations you would like to include. Selecting the locations panel, and going to “Custom” will allow you to access your new location.
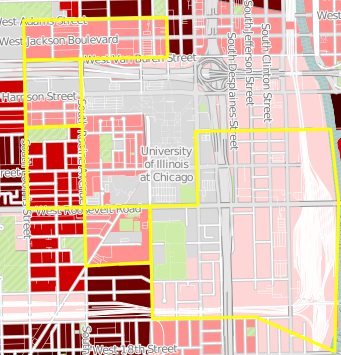
Below is a map representing the new custom location.
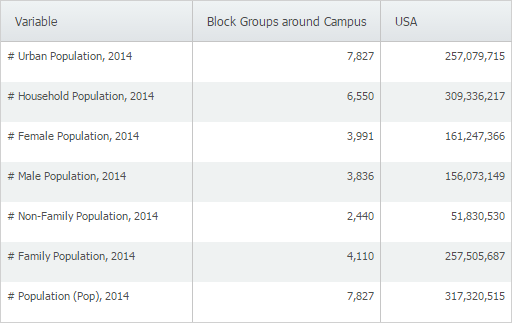
One of the additional features of creating a custom location, is that this location can be utilized throughout your reports. SimplyMap will combine the data from each individual location, and present the total for the combined custom location.
Method #2
The second method of creating a custom combination does not require the user to have the location in a recent or favorites, as described above.
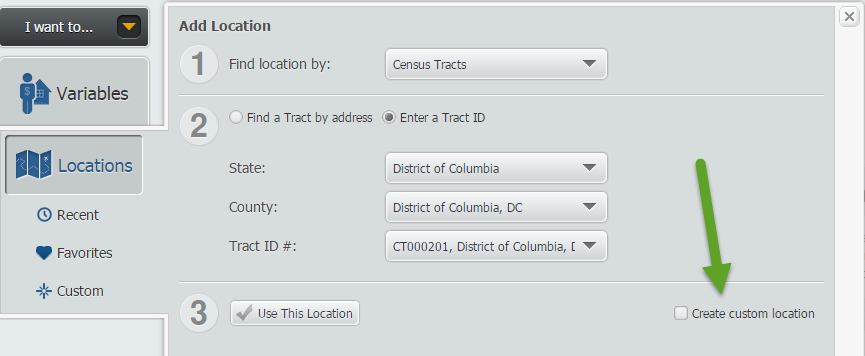
1. Go to locations, and select your geography.
2. Check the box for Custom Location, as shown below:
3. Select "Combination Location" (by default the Radius Location will be checked)
4. If you don't already have a custom area, select "Create Combination" and give the target area a name, as shown below:
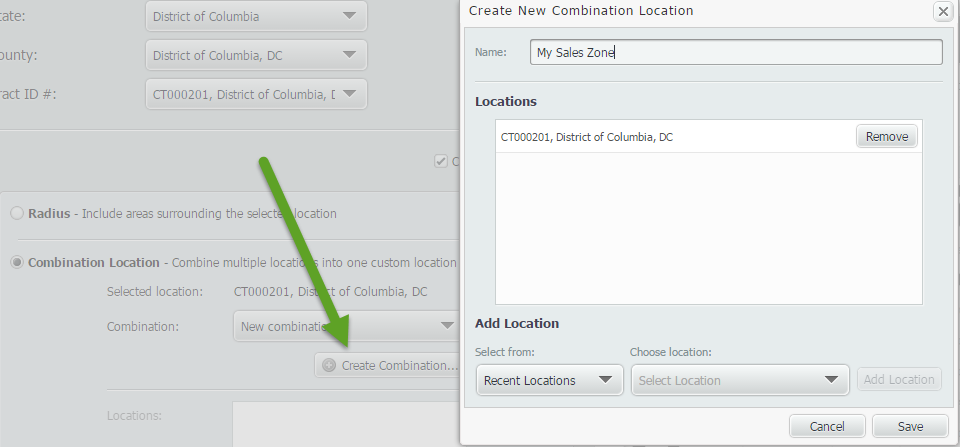
5. Save
6. Now you can select the drop down of locations and add them into your new custom combination that you created.
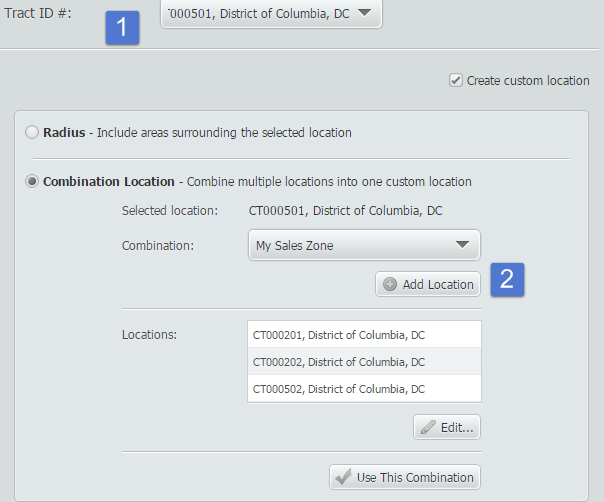
When you're ready to use your new location, select "Use This Combination"
Stay tuned for more SimplyMap tips and tricks! And don’t forget to follow us on Twitter @SimplyMap.
More from SimplyAnalytics
Posted on Dec 19, 2016 by Admin
Stop by the Geographic Research booth [#T8] at the Ontario Library Association Super Conference to get a hands-on look at our latest and greatest SimplyMap offering. The conference will t...
Posted on Oct 08, 2008 by Admin
Geographic Research, Inc. (GRI) is pleased to sponsor the fourth annual American Collegiate Retailing Association’s Undergraduate Student Retail Analysis Competition. This is the second ...
Posted on Sep 20, 2019 by Admin
Hello readers! Today we have a brief update for you on what’s new in SimplyAnalytics. Since the release of the Quick Report feature a few months ago, we have been asked to make this repor...
Posted on Apr 05, 2019 by Admin
Come visit the SimplyAnalytics booth (325) at the upcoming ACRL 2019 show in Cleveland! Say hello, grab a chocolate, and stay for a quick demo of SimplyAnalytics. The team will be showcas...
Posted on Dec 15, 2014 by Admin
Custom Locations allow SimplyMap users to combine several locations into one larger region. For example, you can use this feature to combine three adjacent ZIP Codes to create your study ...
Posted on Nov 10, 2017 by Admin
Welcome to this week’s SimplyAnalytics blog post. Today we’re going to take a closer look at the options available to you when editing the map legend. Let’s get started! First, to start e...
Posted on Mar 02, 2018 by Admin
In this week’s blog we’ll take a look at how to enter an address in SimplyAnalytics to find the Census Block Group or Census Tract. Let’s get started! Use Case: You want to analyze the ar...
Posted on Oct 12, 2010 by Admin
NC LIVE, a member-driven library service organization dedicated to providing online information services that support education, enhance statewide economic development, and increase qu...
Posted on May 15, 2015 by Admin
In this week’s SimplyMap report, we want to share with you the many options available when exporting maps in SimplyMap. In SimplyMap, when a user selects Export Map Image from the Actions...
Posted on Sep 10, 2010 by Admin
SimplyMap Canada is now available at several Canadian institutions, including York University and Ryerson University, in Toronto. SimplyMap Canada has all of the great features included i...