 Go up
Go up


SimplyMap Tip: Exporting Maps
Posted on May 15, 2015 by Admin
In this week’s SimplyMap report, we want to share with you the many options available when exporting maps in SimplyMap. In SimplyMap, when a user selects Export Map Image from the Actions bar, you will be presented with a 3 step export process. This report will cover all options available from each step. Let’s get started!
Step 1 - CROPPING
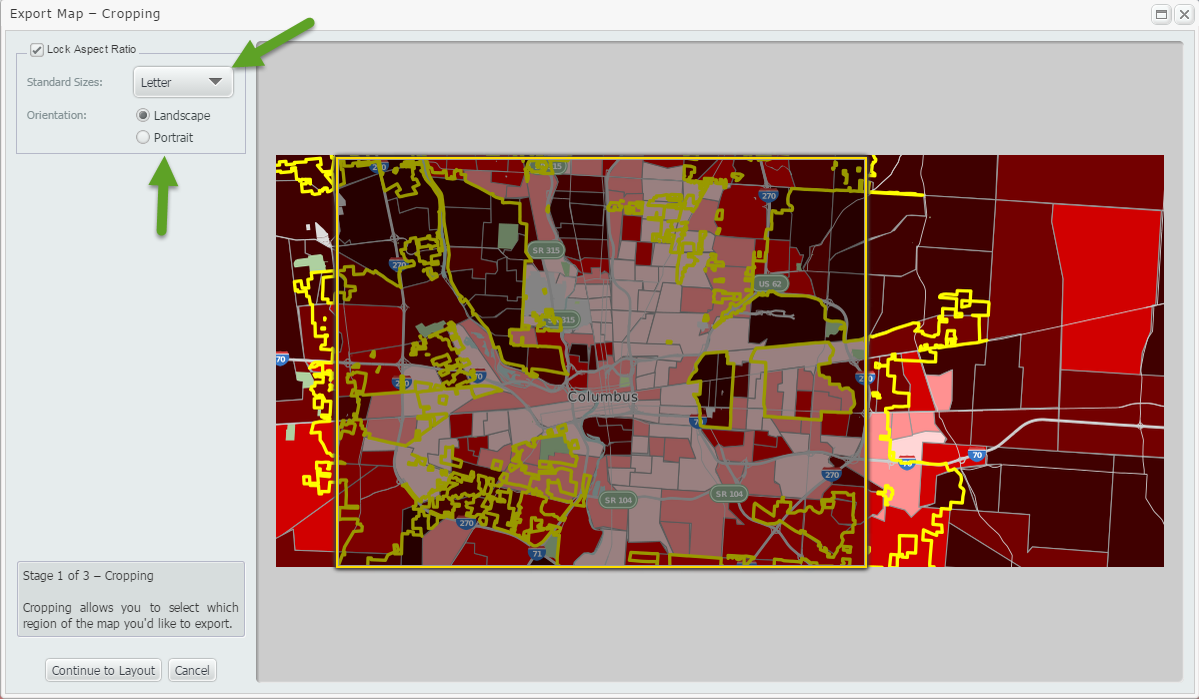
The arrows in the image below refer to the Standard Size and Orientation of your cropping square. Changing either of these options will alter the cropping square to your selection.
Options available for Standard Size: Letter, Legal, Tabloid
Orientation: Portrait or Landscape
If you prefer instead to customize the size and shape of your cropping area, you may do so by clicking and dragging along an edge or corner of the box until the area meets your desired specifications. Example shown below:
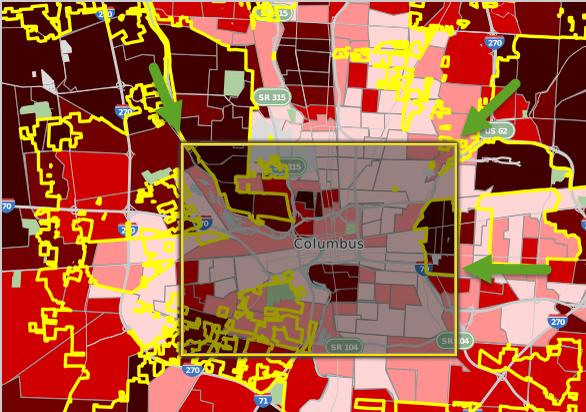
With the cropping area to your choosing, advance to the next step of the export process by selecting “Continue to Layout” from the bottom left side of the cropping menu.
Step 2 - LAYOUT
This step allows users a myriad of customization options. Let’s take a look at these.
Adding a Label - Located towards the top of the menu is a button to “Add Text Label”. Once selected, you may enter a title and change the color or font size of your labels. Feel free to add additional labels as needed.
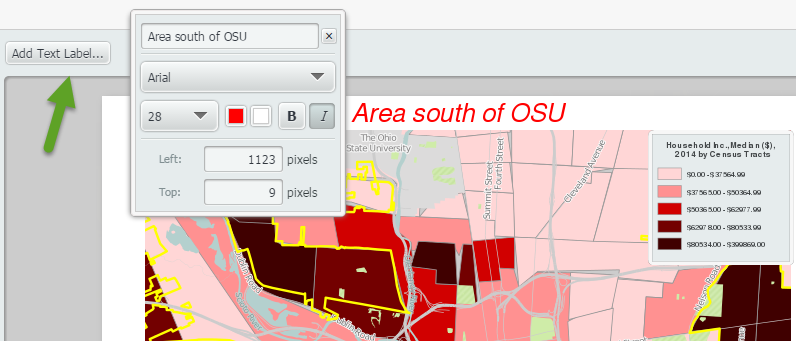
Tip: You can also move the location of the label itself to anywhere in or around your map.
Adding an Inset Map and North Arrow - The bottom left side of the menu will present checkboxes to add an inset map or north arrow. Selecting one or both will add them to your map.
Picture of Inset Map:
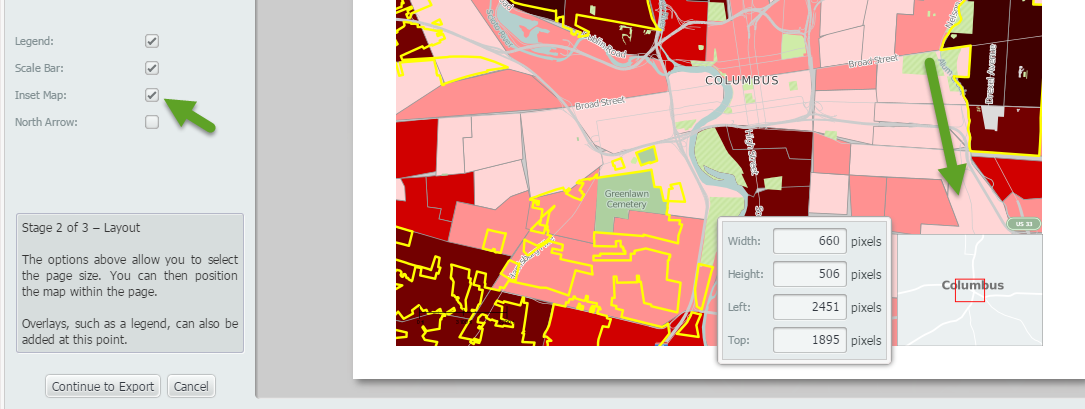
Tip: You may resize or relocate your inset map as needed by selecting the map and moving it to a new location and editing the width, height, left, and top values.
Picture of North Arrow:
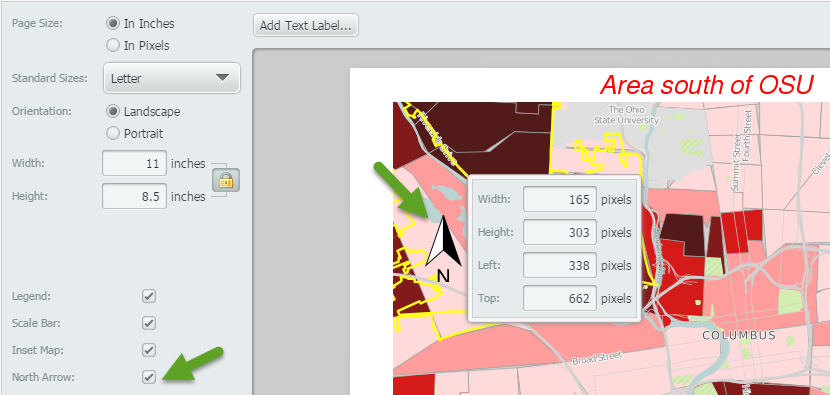
Tip: Similar to the inset map and labels, you may relocate and resize your arrow.
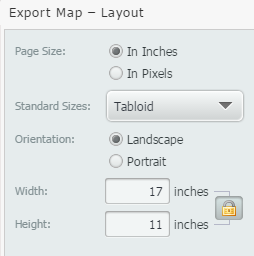
Adjusting Page Size, and Orientation: The page size, and orientation options will allow you to tailor the final layout presentation of your image. For custom sizes, there is an option to edit the width and height values as shown below:
Step 3 - Export your Map
The final step in the exporting process is to choose your file format and method of delivery.
Available file formats: PNG, JPEG, SVG and PDF
Delivery options: Email or direct download
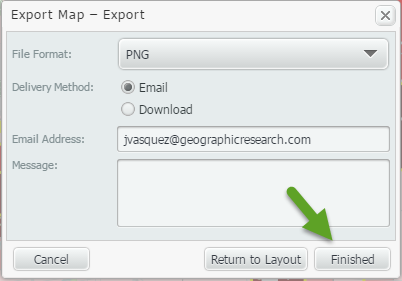
Click “Finished” to export your map!
We hope you enjoyed this SimplyMap feature showcase - let us know if there’s anything in particular you would like to see explained!
More from SimplyAnalytics


Posted on Aug 22, 2009 by Admin
Lynda Kellam, the Data Services & Government Information Librarian at the University of North Carolina, Greensboro has produced some new tutorial videos to help students learn how to ...
Posted on Nov 28, 2023 by Admin
Hello readers! We are happy to announce that SimplyAnalytics has successfully migrated to the Census 2020 boundaries on Sunday, November 19th. This blog will talk about what that is, what...
Posted on Jul 14, 2009 by Admin
Men's Health continues to utilize SimplyMap to identify and rank U.S. cities. This time they are studying "sports-obsessed citizenry," and here is how they did it: Our stat showdown began...
Posted on Nov 29, 2009 by Admin
Legal Information Alert, a monthly newsletter covering what's new in legal publications, databases and research techniques, published a review of SimplyMap in their April 2009 issue title...
Posted on Dec 08, 2017 by Admin
Good afternoon, readers! This week we’re going to talk about project management in SimplyAnalytics and how to best take advantage of it. Why are projects needed? Many users have multiple...
Posted on Jun 09, 2016 by Admin
In this week’s blog, we’ll be featuring our newest data offering, PRIZM® Premier. If your institution currently subscribes to PRIZM data, this new module is available at no additional cos...
Posted on May 17, 2012 by Admin
We will be exhibiting at the American Library Association (ALA) Conference in Anaheim Friday June 22nd - Monday June 25th. Visit us at Booth 421 to learn more about SimplyMap and enter ou...
Posted on Jan 05, 2018 by Admin
The SimplyAnalytics team is looking forward to exhibiting at the Ontario Library Association Super Conference 2018! Stop by the SimplyAnalytcs booth (115T) and take a look at our newest o...
Posted on May 23, 2012 by Admin
We will be exhibiting at the Special Libraries Association (SLA) annual conference and Info-Expo at McCormick Place in Chicago Sunday June 15th - Tuesday July 17th. Visit us at Booth 124 ...
Posted on Dec 02, 2014 by Admin
Today we take a look at one of the more advanced features in SimplyMap - editing the map legend. Editing the map legend is a great way to not only customize how the data is distributed on...