


COVID-19 Data is Now Available in SimplyAnalytics
Posted on Apr 07, 2020 by Admin
As COVID-19 spreads across the United States researchers need access to the latest data visualization and analytics tools. As a result, the SimplyAnalytics team just added COVID-19 data at the national, state, and county levels to SimplyAnalytics. The data is from USAFacts.org and we update it daily with the latest numbers.
The following data variables are now available in SimplyAnalytics:
- Confirmed COVID-19 Cases by date
- Prevalence of confirmed COVID-19 cases (per 100,000 individuals) by date
- Deaths from COVID-19 by date
- Prevalence of deaths from COVID-19 (per 100,000 individuals) by date
You can find the COVID-19 data in SimplyAnalytics in two places:
- [recommended] Go to the Data tab, click on the "Data Folder" view (located just below the data search box), then scroll to the bottom of the list of data folders, or
- Go to the Data tab, click on the Health category icon, then check the box next to COVID-19 in the list of health sub-categories
This data can be combined with our demographic and health data variables to identify areas with vulnerable residents, such as the elderly, people with respiratory illnesses, and smokers.
Here are the best ways to view this data in SimplyAnalytics:
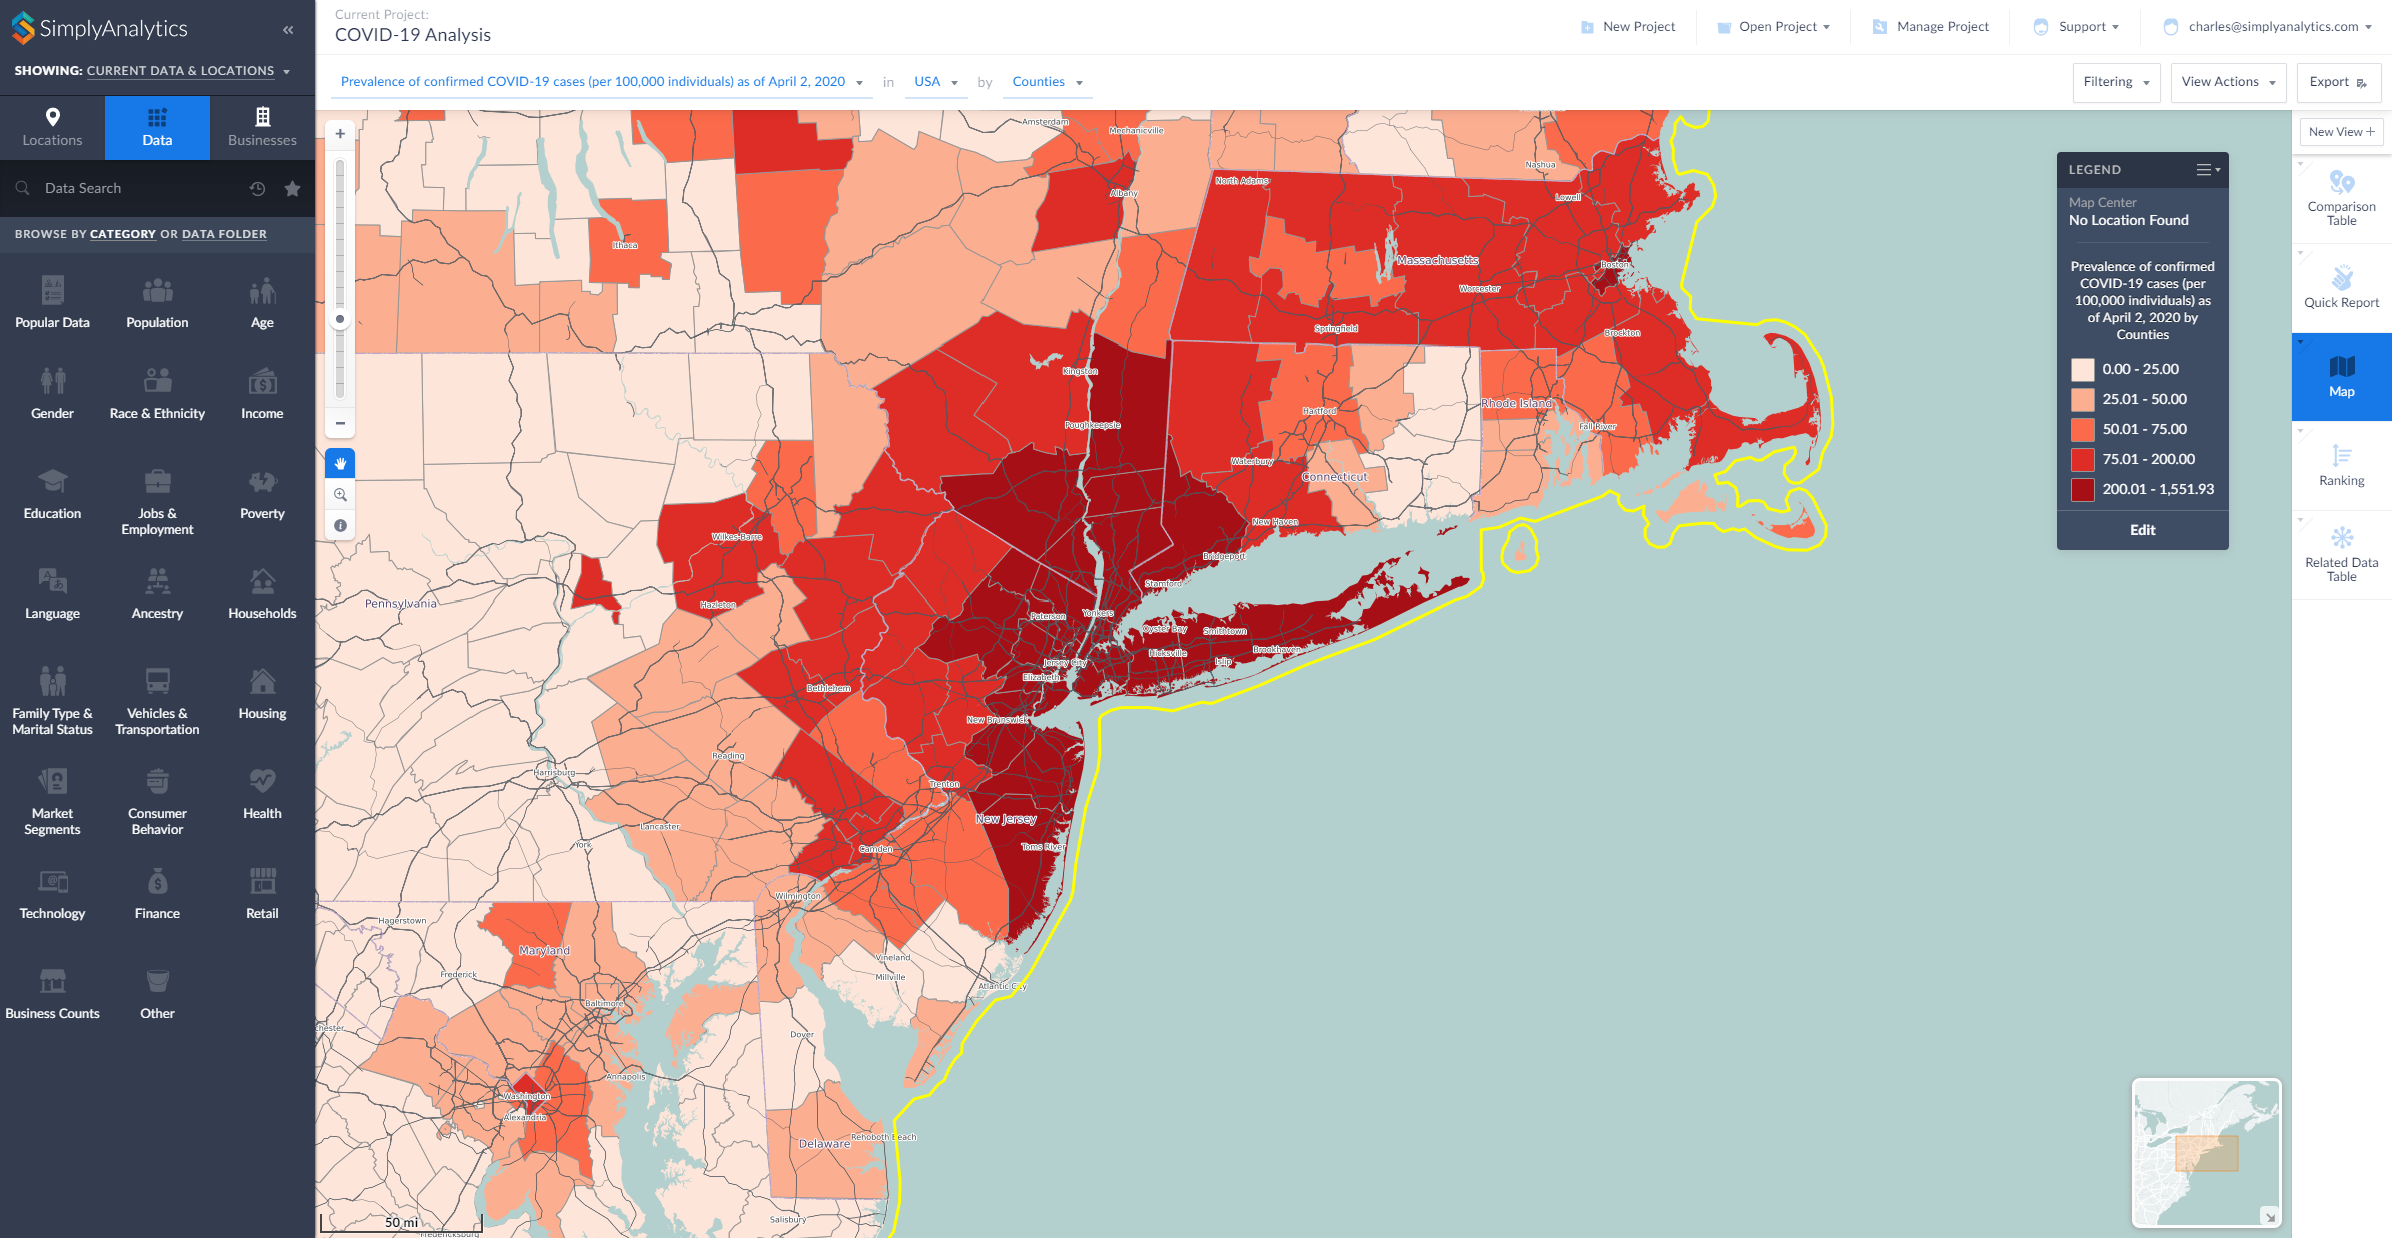
- Map View: map the COVID-19 data by County or State
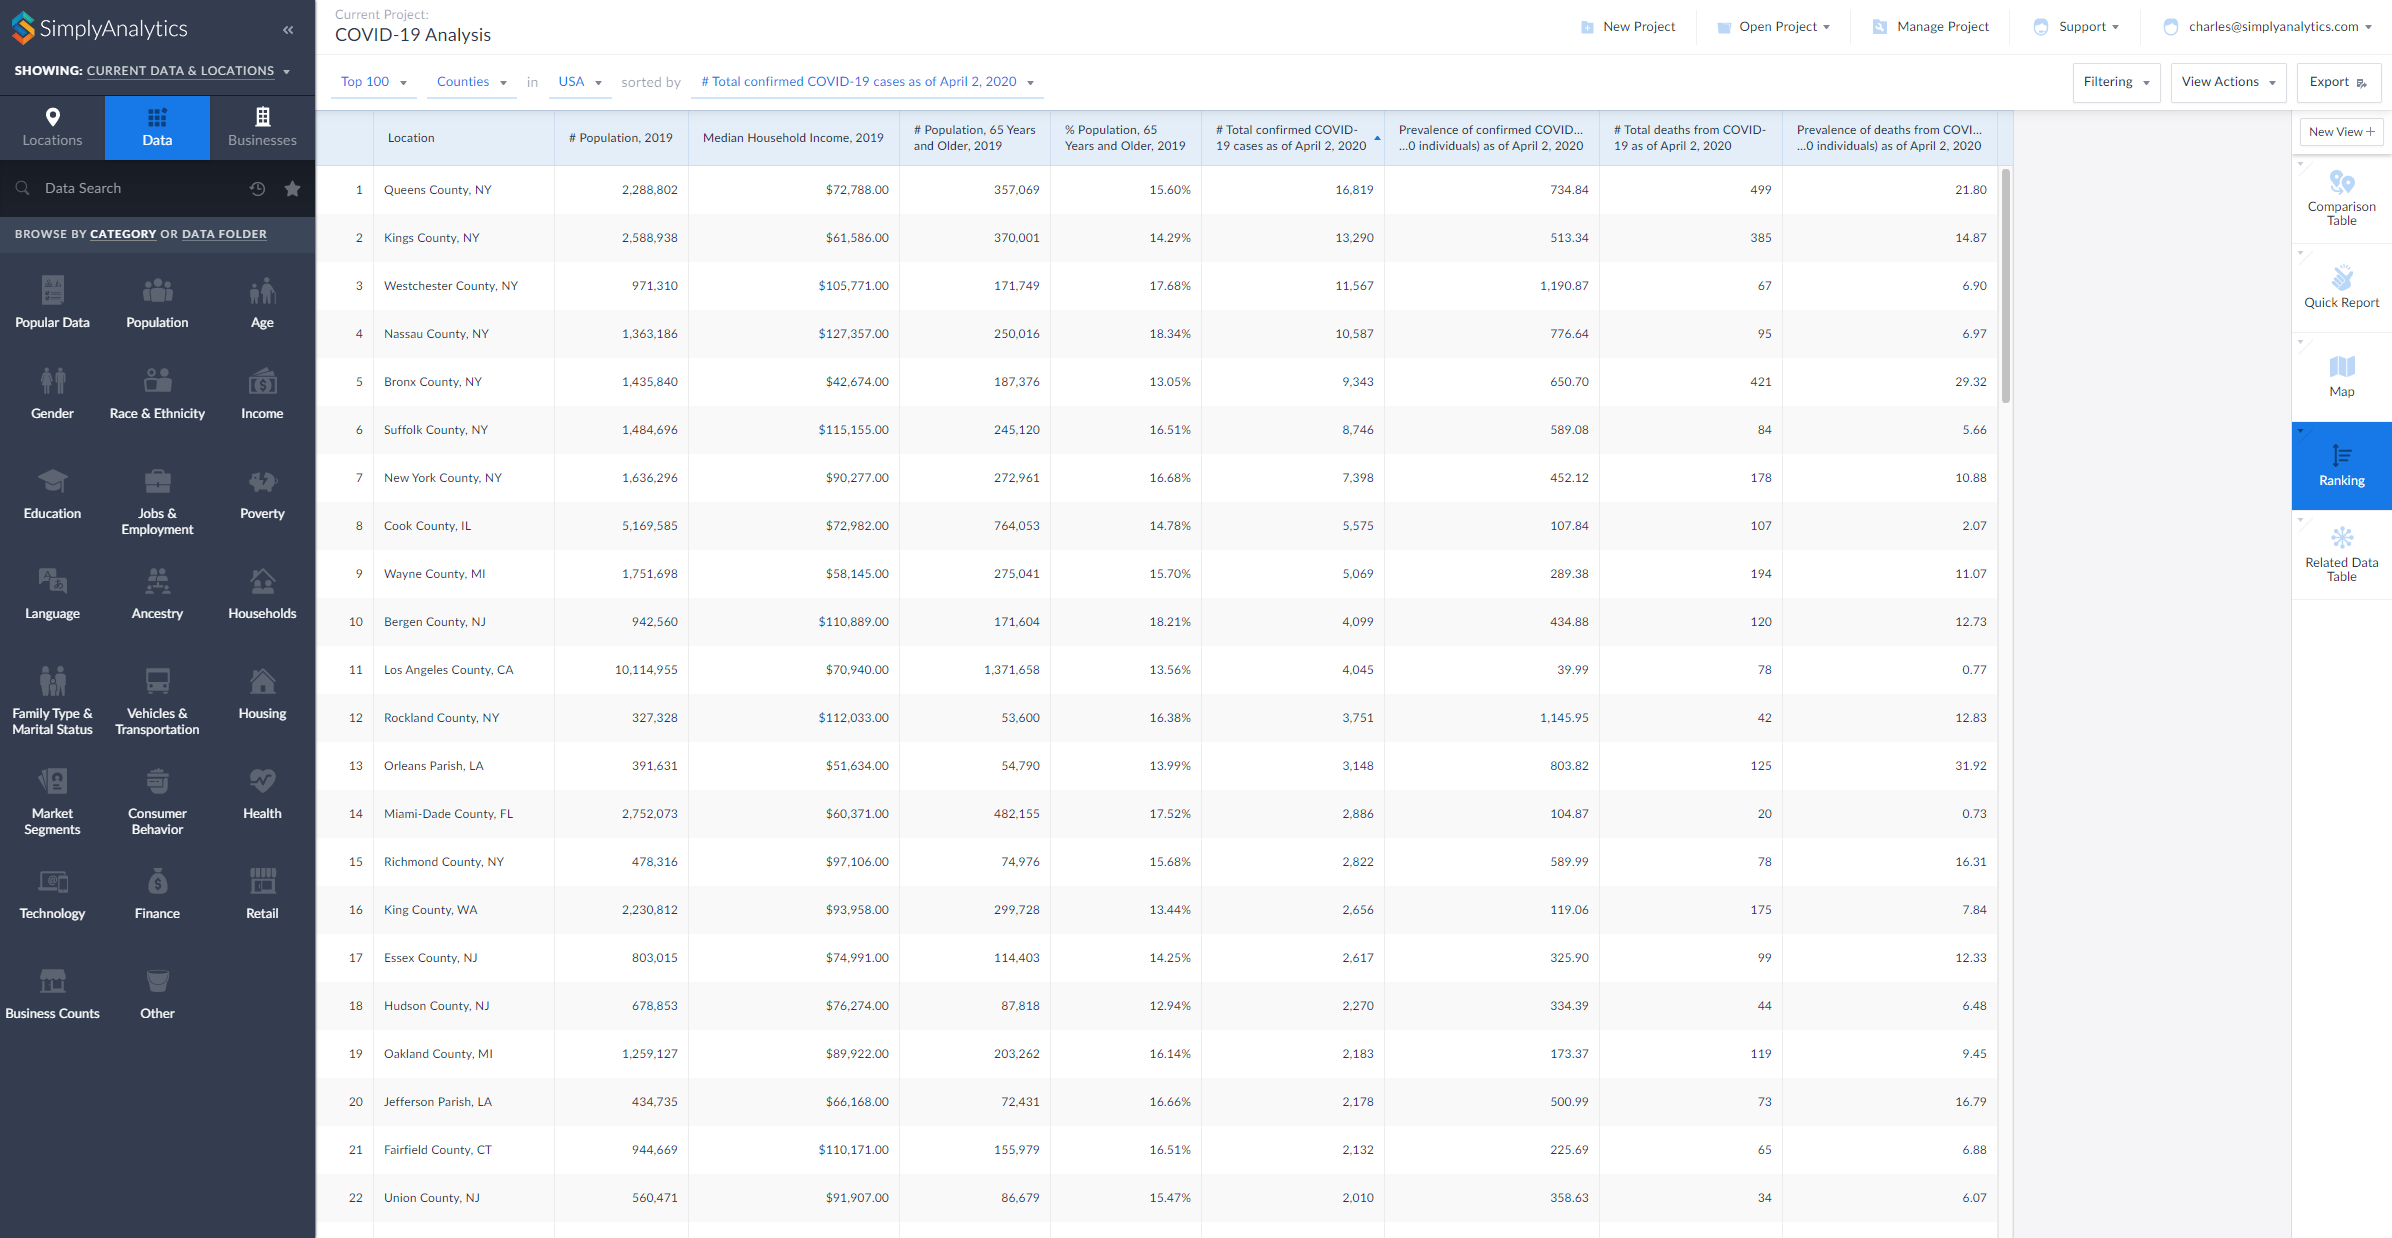
- Ranking View: rank all counties in the United States to identify areas with the highest counts or rates of COVID-19
- Comparison Table View: add your counties and states and any COVID-19 variables to this report to compare rates over time
- Related Data Table View: add one variable from a folder to this view and all of the rest will be added automatically
Here are two examples showing the data being used in SimplyAnalytics, a map and a ranking (click to enlarge):
During this difficult time we are committed to providing remote access and high quality customer support to all of our users who are now working remotely. Please contact us at support@simplyanalytics.com if you have any questions.
More from SimplyAnalytics
Posted on Nov 10, 2017 by Admin
Welcome to this week’s SimplyAnalytics blog post. Today we’re going to take a closer look at the options available to you when editing the map legend. Let’s get started! First, to start e...
Posted on Dec 15, 2014 by Admin
Visit the SimplyMap team at the ALA Midwinter Meeting in Chicago late January. We will be at booth #2824 offering product demonstrations, tips & tricks, and of course Ghirardelli Choc...
Posted on Jul 20, 2020 by Admin
Hello readers! We hope you are doing well and staying safe. Today we are excited to introduce the Simmons NCS crosstabs functionality! This is a feature we’ve been working on for a while,...
Posted on Feb 14, 2017 by Admin
In previous blog entries, we highlighted the value of having a mapping application to complement premium data when analyzing America's geographic preferences in credit cards, and mayonnai...
Posted on Jun 11, 2026 by Admin
SimplyAnalytics is excited to exhibit at ALA Annual 2026 in Chicago! Visit us at Booth #4336 to meet our team, ask questions, and learn more about the latest SimplyAnalytics features and ...
Posted on Jun 25, 2015 by Admin
In this week’s SimplyMap report, we review the different options available when searching for a business. The easiest and fastest method of mapping businesses or creating a business repor...
Posted on Jun 16, 2016 by Admin
This week’s SimplyMap report is a quick tip that we hope you find useful and time saving. Did you know that SimplyMap will save all recently searched business queries for future usage? Le...
Posted on Oct 07, 2013 by Admin
Do you know the quickest way to find the name of a Block Group, Census Tract or ZIP code in our upcoming release for 3.0? The i-Tool gives you the ability to click anywhere on a map to g...
Posted on Mar 02, 2015 by Admin
In this week’s SimplyMap tip, we outline the process of creating a radius location. Radius locations are a great way to quickly gather information from an area surrounding a target addres...
Posted on Mar 10, 2011 by Admin
The GRI team is looking forward to exhibiting at ACRL 2011 at the PA Convention Center in Philadelphia, March 30 - April 1, 2011. Every other year, ACRL offers its premier professional d...