


Retail Market Power: Manhattan’s Jewelry and Car Sales
Posted on Jul 26, 2016 by Admin
In this week’s SimplyMap report, we’ll take a look at the Retail Market Power dataset and provide a simple, effective example of how the data package can be used. If your institution currently does not subscribe to Retail Market Power, please have a representative reach out to set up a free trial.
What is Retail Market Power?
The Nielsen Retail Market Power database provides an actionable portrait of sales opportunity for market analysis, so marketers can maximize growth strategies by identifying and closing the sales gaps that exist in the marketplace. By using sales potential to depict supply, and geography-based estimates of potential annual consumer expenditures to depict demand, Retail Market Power enables an opportunity gap analysis of the retail environment.
Example - NYC’s Jewelry and Vehicle Sales
By analyzing a geography’s retail sales and expenditures within an industry, you can determine whether or not a gap or opportunity exists. Let’s look at some data.
In a Standard Report, add the following four variables for analysis. They can be found at this path if your institution subscribes to the package: Retail Market Power » Expenditures » Jewelry:
Retail Sales for Jewelry (HH Avg), 2016
Retail Sales for Jewelry ($), 2016
Expenditures for Jewelry (HH Avg), 2016
Expenditures for Jewelry ($), 2016
Open the Locations panel and add in New York County which is coterminous with Manhattan. Close out the panel to generate your report. Results below:
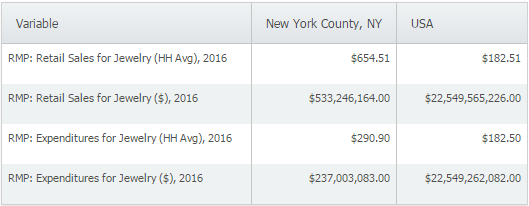
What does this mean?
In effect, the data is showing that people are coming from outside of Manhattan to purchase their jewelry. How do we know this? The retail sales for jewelry in Manhattan ($533,246,164) far exceeds what Manhattan residents are spending themselves on jewelry ($237,003,083). It’s fair to assume Manhattan’s renowned diamond district is driving the high sales.
Now let’s take a look at the reverse. In separate Standard Report, add the following variables:
Retail Sales for Cars, Trucks, and Other Powered Transportation (HH Avg), 2016
Retail Sales for Cars, Trucks, and Other Powered Transportation ($), 2016
Expenditures for Cars, Trucks, and Other Powered Transportation (HH Avg), 2016
Expenditures for Cars, Trucks, and Other Powered Transportation ($), 2016
Select Recent from the Locations panel to quickly add in New York County once again and close out the panel to generate your report.
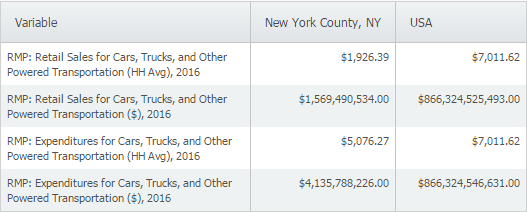
The data here reveals that Manhattan residents are purchasing their cars, trucks and other vehicles from outside of Manhattan - this seems logical as there is limited real estate within Manhattan to support many large car dealerships.
We hope you found this quick write up useful - is there any other industries or locations you’d like to see? Let us know in the comments, and stay tuned for more!
More from SimplyAnalytics
Posted on Feb 20, 2018 by Admin
We are looking forward to attending the annual SCELC (Statewide California Electronic Library Consortium) Vendor day, at Loyola Marymount University in Los Angeles on March 8th. In additi...
Posted on Nov 06, 2019 by Admin
Hello readers! We hope you’re having a wonderful week. Today we feature another entry from our From the Help Desk series. Let’s get started! Question: How do I analyze data for downtown? ...
Posted on Jan 15, 2013 by Admin
The GRI team is looking forward to exhibiting at ACRL 2013 at the Indiana Convention Center in Indianapolis April 10 - 12, 2013. Every other year, ACRL offers its premier professional dev...
Posted on Nov 04, 2013 by Admin
SimplyMap 3.0 is here, and uses the latest technology to provide better performance, improved reliability, and powerful new features. There are many improvements designed to make it easie...
Posted on May 08, 2018 by Admin
This summer's ALA conference is in New Orleans and the SimplyAnalytics team will be exhibiting at booth #837. We hope you stop by to learn about new features, check out our new data offer...
Posted on Dec 11, 2015 by Admin
With the final week of the college football season in the books, and bowl game selections having just taken place, we wanted to search within SimplyMap to see if any data pertaining to co...
Posted on May 19, 2015 by Admin
We will be attending ALA this summer in San Francisco (hint: dress warm!). Visit us at Booth 413 and don't forget to enter our raffle - we will be giving away a $100 gift certificate to A...
Posted on Oct 23, 2009 by Admin
SimplyMap was highlighted in the Wake County, NC Public Library Business Blog today as a valuable tool for business planning. Wake County has access to SimplyMap through NC LIVE, a statew...
Posted on Dec 12, 2011 by Admin
Men's Health magazine has published a ranked list to help readers find the cities where Americans are the saddest and where they are living with big smiles on their faces. As they note, "...
Posted on Dec 07, 2021 by Admin
Hello readers! We hope you are enjoying the holiday season as much as we are. Today, we are happy to announce a couple of improvements to SimplyAnalytics designed to help you get your res...