


Exploring SimplyMap Data: Consumer Buying Power
Posted on Apr 21, 2015 by Admin
In this week’s edition of exploring SimplyMap data, we spotlight the Consumer Buying Power® data package in SimplyMap.
What is it? The Nielsen Consumer Buying Power® database incorporates geography-based estimates of potential annual consumer spending for more than 350 household expenditure items.
This effectively allows researchers to determine a target area for potential consumers or buyers of a given type of product. Let’s take a look at an example.
Scenario: You want to identify target cities in Florida that would be most interested in home cooking products and appliances.
Using the CBP dataset, we can easily locate some target cities. Here’s how:
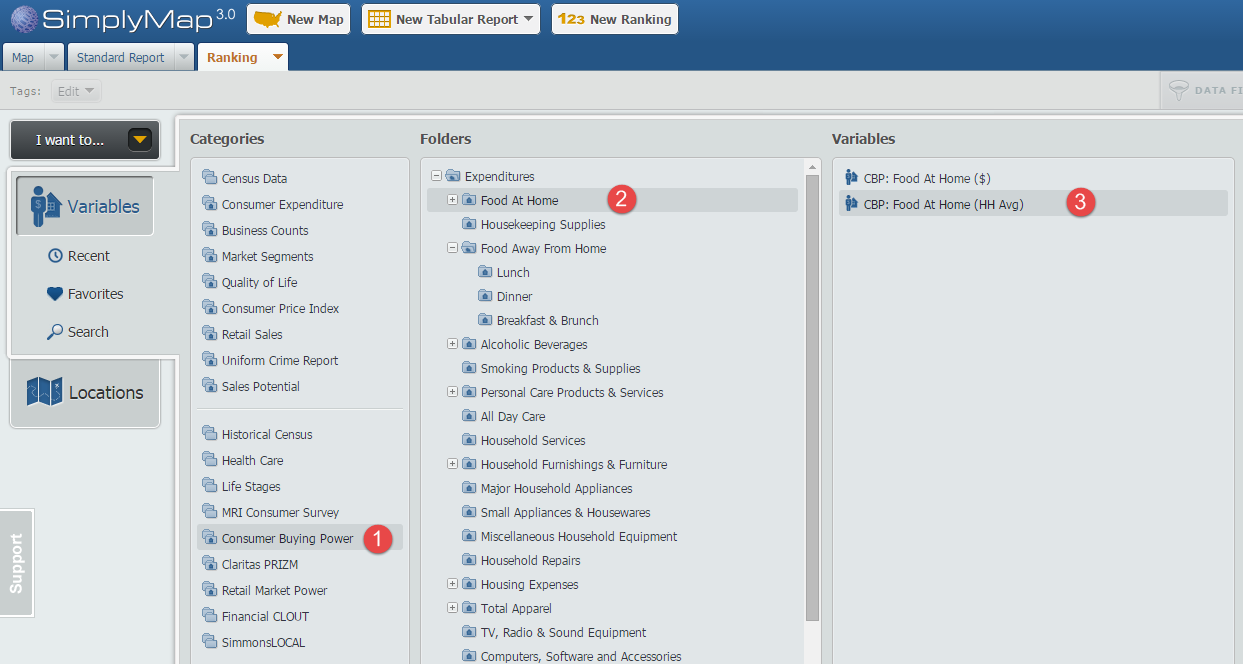
First, create a ranking report using Florida as the location. Next, navigate through the following path to select the variable, CBP: Food At Home (HH Avg).
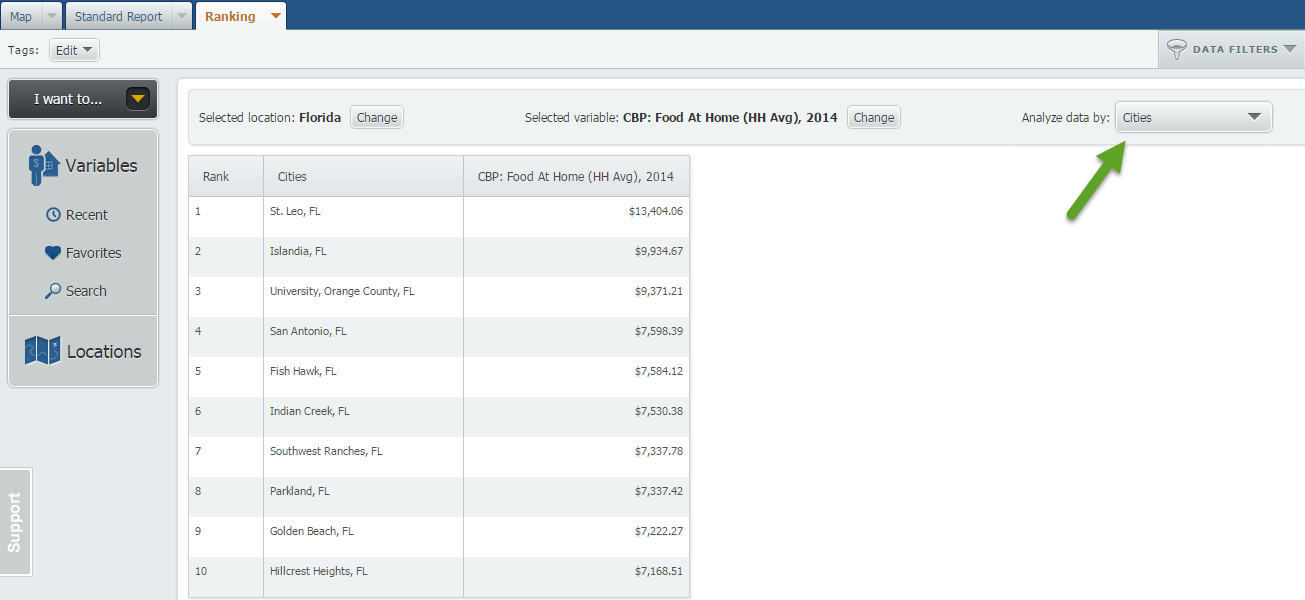
Next, use the Analyze Data By feature and select cities to reveal your target areas.
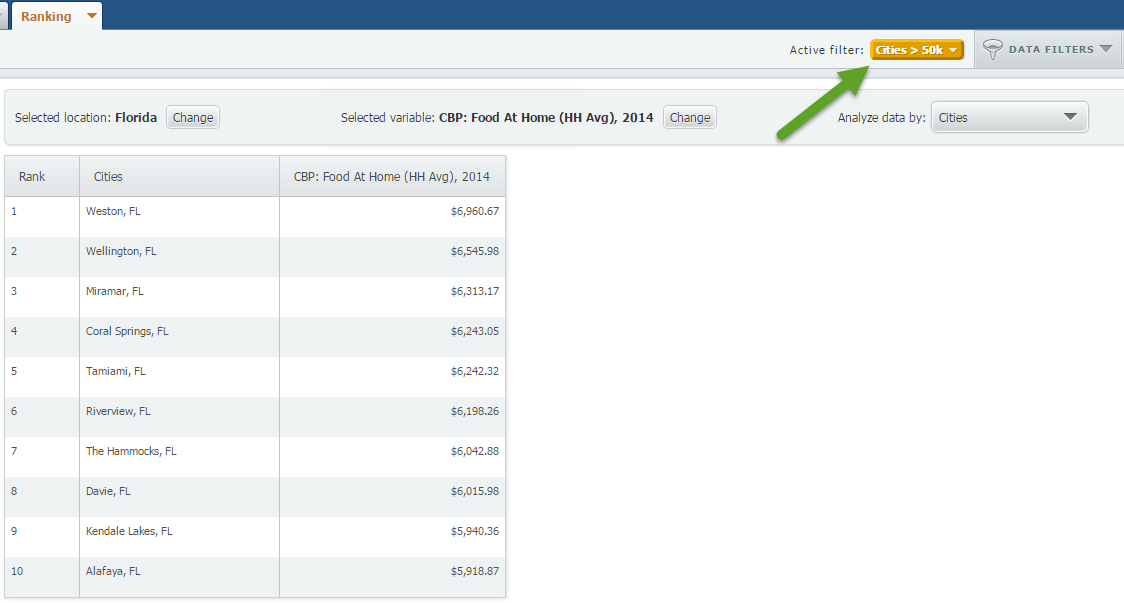
And that’s all there is to it! You might then be only interested in cities with a population of at least 50k. This can easily be done by applying a data filter (read more here). The new results are shown below:
Interested in specific maps or a particular dataset? Let us know!
More from SimplyAnalytics
Posted on May 16, 2022 by Admin
Hello readers! We hope you are having a wonderful day. Today we feature a question from the help desk that we think many users would find useful. Let’s get started. The question: How can ...
Posted on Jul 20, 2020 by Admin
Hello readers! We hope you are doing well and staying safe. Today we are excited to introduce the Simmons NCS crosstabs functionality! This is a feature we’ve been working on for a while,...
Posted on Oct 24, 2019 by Admin
Hi everybody! This week we wanted to bring you something unique, so we’re taking you behind the scenes to show you what goes in to setting up the SimplyAnalytics conference booth you’ve c...
Posted on Dec 15, 2014 by Admin
Visit the SimplyMap team at the ALA Midwinter Meeting in Chicago late January. We will be at booth #2824 offering product demonstrations, tips & tricks, and of course Ghirardelli Choc...
Posted on May 06, 2013 by Admin
The GRI team is looking forward to exhibiting at SLA 2013 at the San Diego Convention Center, June 9th through the 11th. The Special Libraries Association (SLA) is a nonprofit global orga...
Posted on Jan 18, 2009 by Admin
Michigan State University is offering their users a basic introduction to using SimplyMap. The 1.5 hour session will cover the basics of how to use SimplyMap to create maps and reports u...
Posted on Apr 07, 2020 by Admin
As COVID-19 spreads across the United States researchers need access to the latest data visualization and analytics tools. As a result, the SimplyAnalytics team just added COVID-19 data ...
Posted on May 08, 2018 by Admin
This summer's ALA conference is in New Orleans and the SimplyAnalytics team will be exhibiting at booth #837. We hope you stop by to learn about new features, check out our new data offer...
Posted on Jan 15, 2013 by Admin
The GRI team is looking forward to exhibiting at ACRL 2013 at the Indiana Convention Center in Indianapolis April 10 - 12, 2013. Every other year, ACRL offers its premier professional dev...
Posted on Jun 02, 2017 by Admin
We will be exhibiting at SLA in Phoenix, AZ on June 18th-20th. You can find the SimplyAnalytics team at Booth #905. Stop by and check out our groundbreaking new interface, have a chocolat...