


Exploring SimplyMap Data: America’s Most Educated Cities
Posted on Nov 24, 2014 by Admin
In this week’s report, we research America’s most educated cities. SimplyMap contains a total of 111 educational attainment variables, including general population and by race.
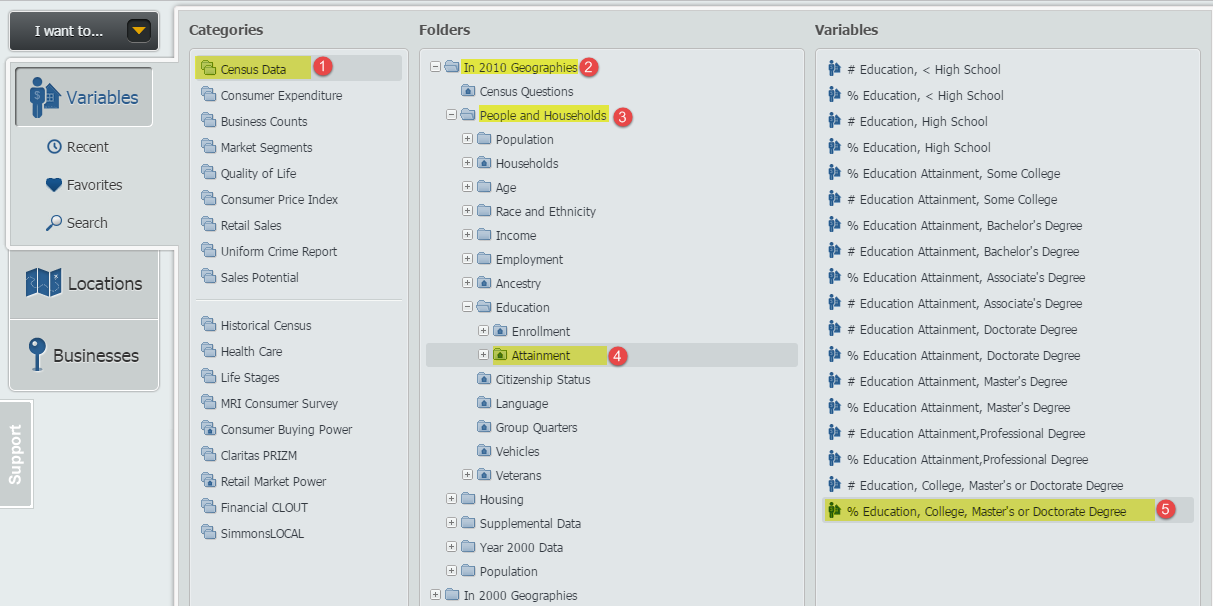
We used the variable “% Education, College, Master’s or Doctorate Degree” to account for all populations possessing at least a bachelor’s degree. This variable can be found using the following path: Census Data >> 2010 Geographies >> People and Households >> Education >> Attainment. The image below details this path.
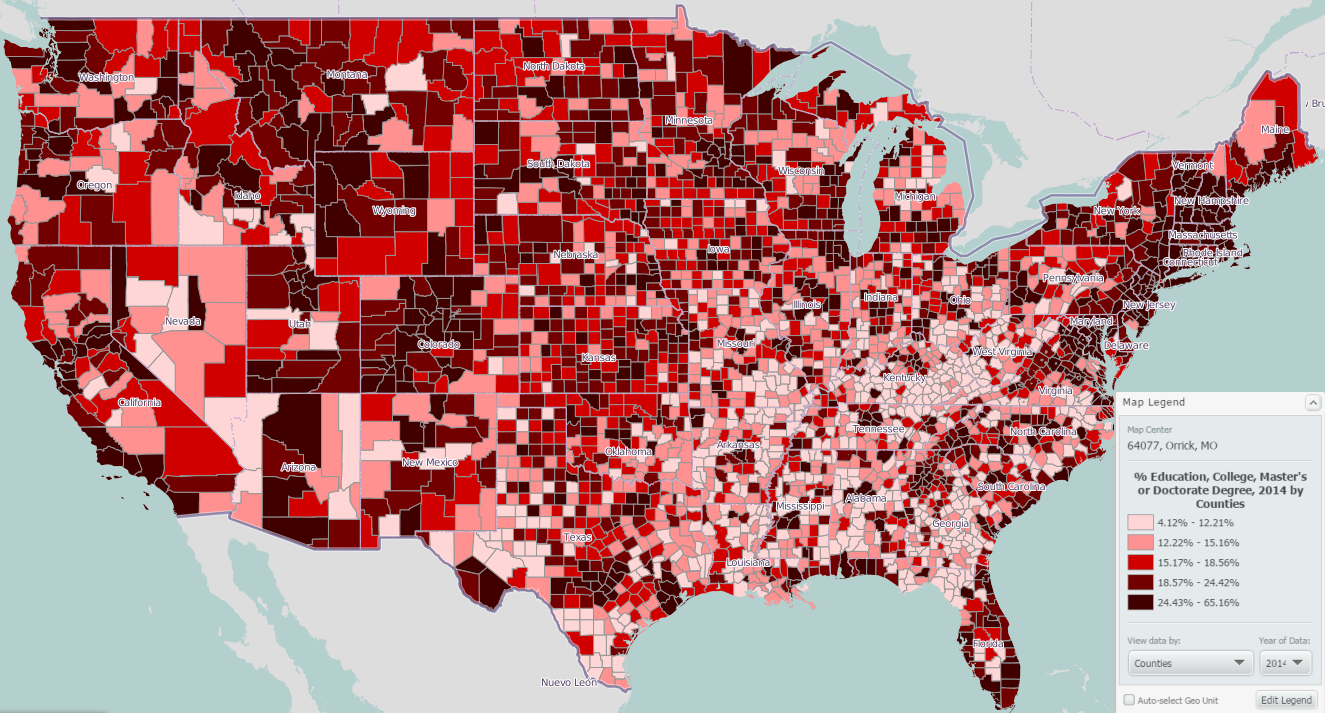
The following US map was then created, shown by county:
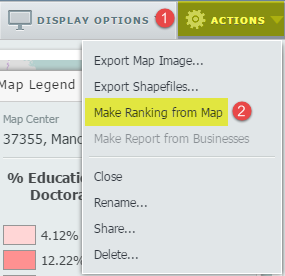
Using the Make Ranking from Map feature while viewing the US, the report will rank county level data by default.
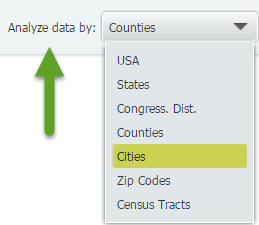
We then utilized the Analyze data by tool found at the top of the results, and changed the geographies to display cities.
Lastly, we applied a data filter to only show cities with populations greater than 50,000 (read our entry on using the data filter here). In the end, we were left with the following results:
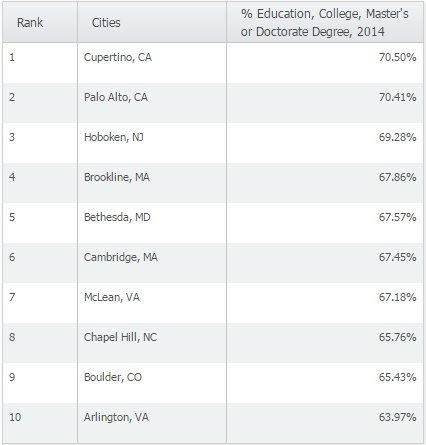
It looks like Cupertino, CA ranks #1 in the US for having the most college graduates at 70.5%, narrowly beating out Palo Alto, CA (70.41%) and Hoboken, NJ (69.28%).
Is there a variable you’re interested in seeing mapped or ranked? Let us know!
More from SimplyAnalytics
Posted on Jul 30, 2008 by Admin
Cornell’s Albert R. Mann Library has subscribed to SimplyMap. They provide some tips and access to the SimplyMap Quick Reference Guide, variable list, and some information on the EASI dat...
Posted on Apr 14, 2016 by Admin
This week’s SimplyMap report will provide an overview of one of the more advanced functionalities in SimplyMap - applying multiple filter conditions. Filters can be applied to any map or ...
Posted on Jan 19, 2009 by Admin
The 2009 Midwinter Meeting will be held in Denver, CO, from Jan 23–28, 2009. http://www.ala.org/midwinter The exhibits will be held Jan 23–26, 2009 at the Colorado Convention Center,...
Posted on Oct 16, 2015 by Admin
Did you know that SimplyMap includes the ability to export Shapefile data for use in desktop mapping software (such as MapInfo or ArcGIS)? This advanced feature extends the power of Simpl...
Posted on Nov 29, 2009 by Admin
The ALA 2010 Midwinter Meeting will be held on January 15-19, 2010 at the Boston Convention and Exhibition Center. (Note that this is not the Hynes Convention Center). Geographic Research...
Posted on Jun 08, 2015 by Admin
In this week’s report we take a look at one folder found within SimplyMap’s SimmonsLOCAL data package. SimmonsLOCAL is a powerful targeting and profiling system that provides insights int...
Posted on Feb 20, 2018 by Admin
We are looking forward to attending the annual SCELC (Statewide California Electronic Library Consortium) Vendor day, at Loyola Marymount University in Los Angeles on March 8th. In additi...
Posted on Mar 21, 2011 by Admin
Men's Health magazine decided to crown one town America's Most Socially Networked City, and has generated quite a buzz in the process. Their survey examined the number of Facebook and Li...
Posted on Apr 07, 2020 by Admin
As COVID-19 spreads across the United States researchers need access to the latest data visualization and analytics tools. As a result, the SimplyAnalytics team just added COVID-19 data ...
Posted on Oct 27, 2017 by Admin
Welcome to our first ever SimplyAnalytics blog! Every Friday we’ll post a write up on a specific feature or highlight some interesting data in SimplyAnalytics. The goal of these posts is ...