


Using Multiple Filter Conditions
Posted on Apr 14, 2016 by Admin
This week’s SimplyMap report will provide an overview of one of the more advanced functionalities in SimplyMap - applying multiple filter conditions. Filters can be applied to any map or report tabs. For example, a map showing Household income levels by ZIP Code could be filtered to only show ZIP Codes with income over a specific threshold. Another example would be to filter the same income map to only show ZIP Codes with a population over 8,000. Using multiple filter conditions is a great way to hone your focus on a narrower set of geographic locations that meet your multiple criteria. Let’s get started with an example.
Scenario: You are looking for the best location to open up a high end salon in California and want to develop an initial list to further analyze. Let’s assume there are three criteria that must be met before considering a location.
1. The location has to have more than 500,000 residents.
2. The location must have a median household income of at least 75,000.
3. At least 30% of households must report spending money at a salon.
The Setup: First, create a new Location Analysis Report and set your location to California. Next, navigate through some pertinent variables and add the following variables that will serve as our criteria.
# Population, Total (Census Data » People and Households » Age » Total)
Household Inc., Median (Census Data » People and Households » Income » HH Income)
% Households Buying - Expenditures: Amount Spent In Total: Beauty Parlor (MRI Consumer Survey » Purchasing » Average HH Spending)
After you have added all variables you are interested in, close out the Variables panel to generate your report. Results below:
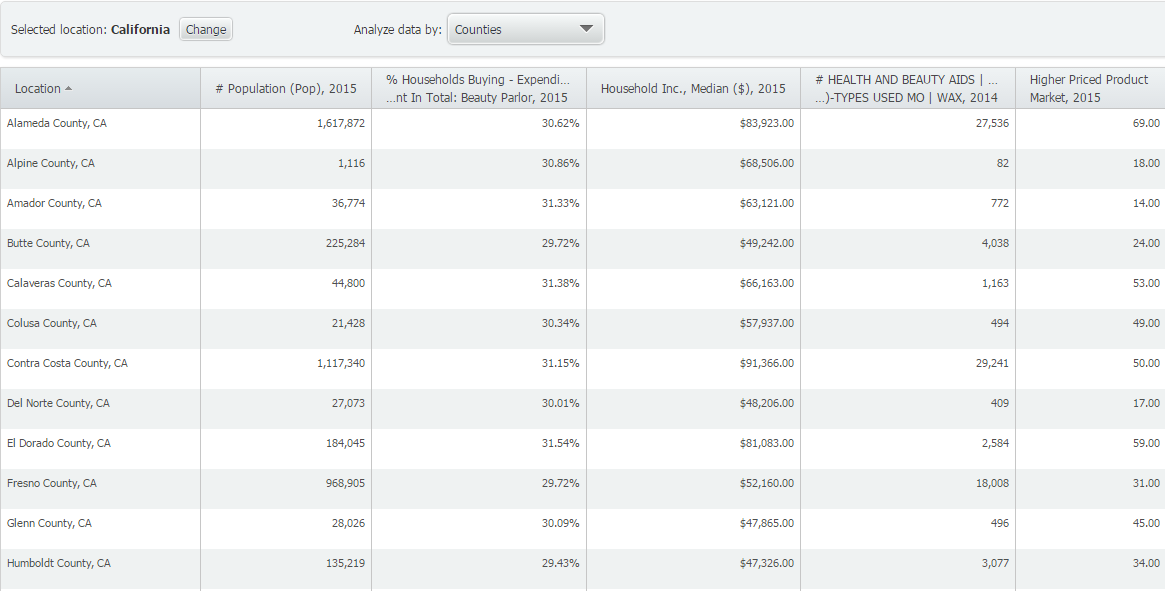
Your initial results will display all counties in California. To create a filter, click on Data Filters > Create New Filter from the top right of SimplyMap. The filter creation dialog will open up.
NOTE: The only variables that will show up as possible filter criteria in the variable dropdown will be either recently used variables, or favorite variables. In this case, we have the variables already in the report, so by default they will show under recently used variables.
1. Select the first dropdown and click on the beauty parlor variable. Leave the second dropdown to “is greater than” and enter a value of 30 in the last box.
2. Click on Add Another Condition to bring up a second variable selection box - choose the population variable and set that to “is greater than” 500,000.
3. Lastly, click on Add Another Condition once more, and find the Median Household Income variable - set this value to “is greater than” 75,000.
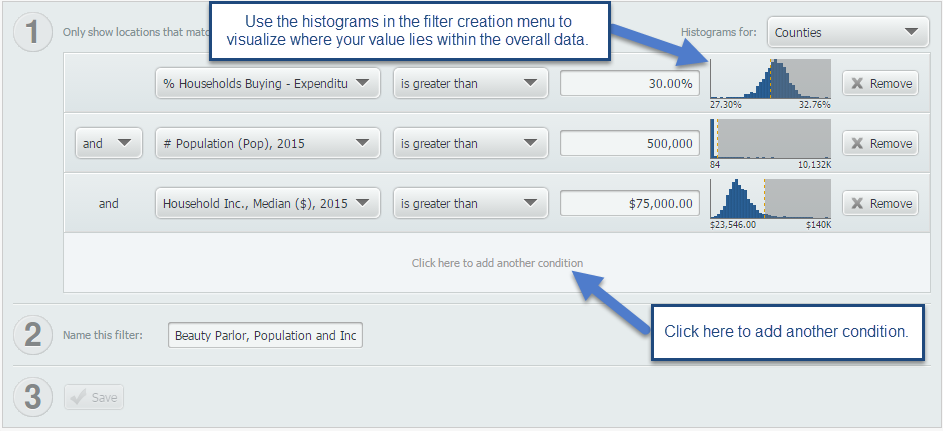
Give your filter a name, and click on SAVE to apply it onto your report. New results below!
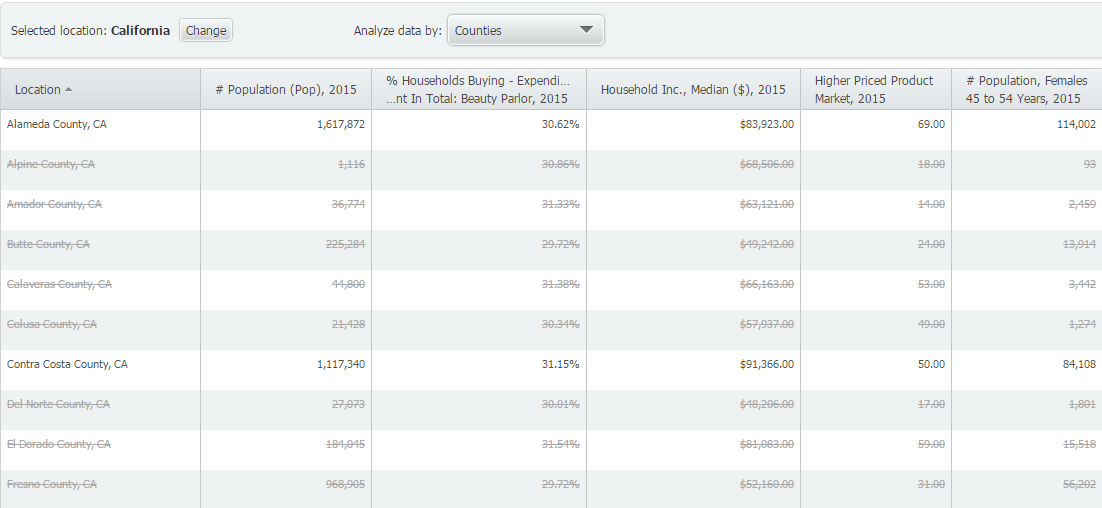
Locations that do not meet your three conditions are then struck out with a line and seen in light gray. If you’d like to hide these locations, click on Display Options > Filtered Locations > Hide. Your final report is shown below:
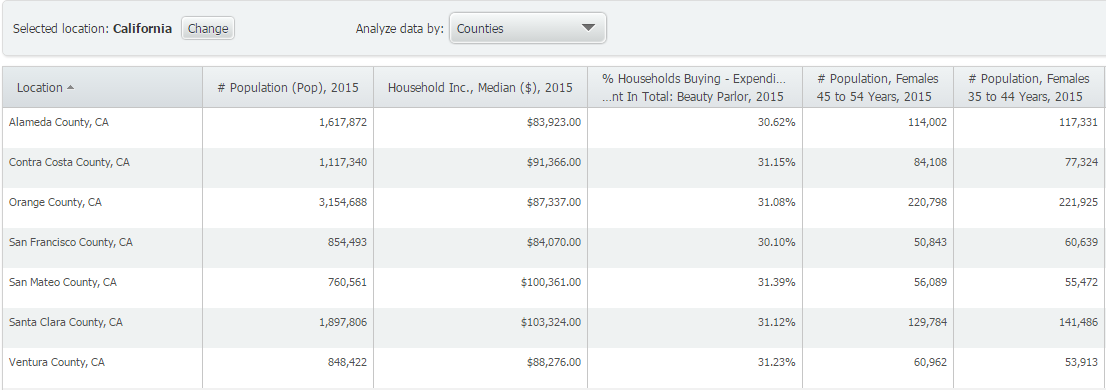
Only 7 of California’s 58 counties meet our specific criteria.
A logical next step for someone doing market research would be to analyze specific ZIP Codes or census tracts within these counties more in depth, and run business reports to see what the competition is like in the target areas.
Do you have any questions on creating and applying filters? Feel free to leave a comment below or send as an email at: support@geographicresearch.com
More from SimplyAnalytics
Posted on Feb 01, 2009 by Admin
Want to know the top 10 wealthiest ZIP codes in your state? How about the top 25 counties with the most elderly residents? Duke University students can now easily answer these questions a...
Posted on Nov 24, 2014 by Admin
In this week’s report, we research America’s most educated cities. SimplyMap contains a total of 111 educational attainment variables, including general population and by race. We used th...
Posted on Jun 02, 2016 by Admin
Three weeks ago we utilized the SimmonsLOCAL data set to visualize contiguous America’s mayonnaise brand preference. Staying with the American visualization theme, this week’s report will...
Posted on Sep 09, 2015 by Admin
This week’s SimplyMap report will set out to discover what America’s favorite type of music is. We will use data within the premium data package, SimmonsLOCAL to answer the question. The ...
Posted on Jul 28, 2013 by Admin
We recently discovered some interesting data on participation and attitudes towards recycling, and decided to dig a bit deeper into our Experian SimmonsLOCAL data. This data package inclu...
Posted on Sep 15, 2025 by Admin
SimplyAnalytics will be attending the upcoming NCLA Conference in Winston-Salem October 14-17!
Posted on Jul 09, 2015 by Admin
In this week’s SimplyMap report, we set out to find which cities have the highest percentages of people who use their bike as their mode of transportation to work in the US. Let’s get sta...
Posted on Sep 28, 2018 by Admin
Welcome readers! Today we have a quick feature highlight that will assist you in browsing and searching for data variables. All data variables have a path where they reside within their d...
Posted on Feb 17, 2015 by Admin
Our recent trip to Chicago exhibiting at the ALA Midwinter Meeting inspired this week’s SimplyMap blog post. Today, we’re going to demonstrate how to use business points in SimplyMap to a...
Posted on Jul 30, 2008 by Admin
Cornell’s Albert R. Mann Library has subscribed to SimplyMap. They provide some tips and access to the SimplyMap Quick Reference Guide, variable list, and some information on the EASI dat...