


Visualizing Brand Preference: Athletic Shoes
Posted on Feb 14, 2017 by Admin
In previous blog entries, we highlighted the value of having a mapping application to complement premium data when analyzing America's geographic preferences in credit cards, and mayonnaise brands. This week we’ll take a look at athletic shoe brand preference in the US for adults 18+.
Similar to the previous entries, we will use the SimmonsLOCAL data set to put these maps together. If your institution does not currently subscribe to the SimmonsLOCAL package, feel free to reach out to us about setting up a free 30-day trial. Let’s get started.
The maps below can each be generated in less than a minute! Open up the Variables panel, and find the variables in question at this path: SimmonsLOCAL » APPAREL » SHOES/ FOOTWEAR » SHOES/ FOOTWEAR - BRANDS.
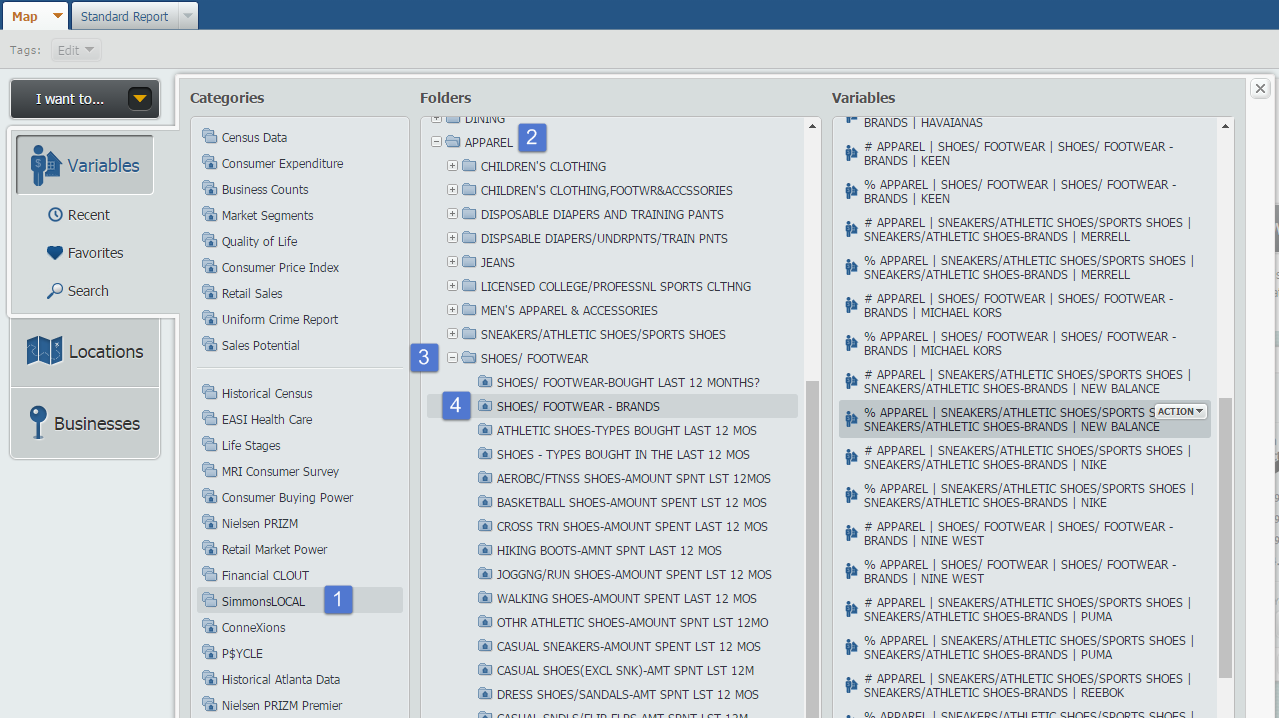
Click on the variable you are interested, and close out the panel to automatically generate a map of the United States. Results for 3 different brands below!
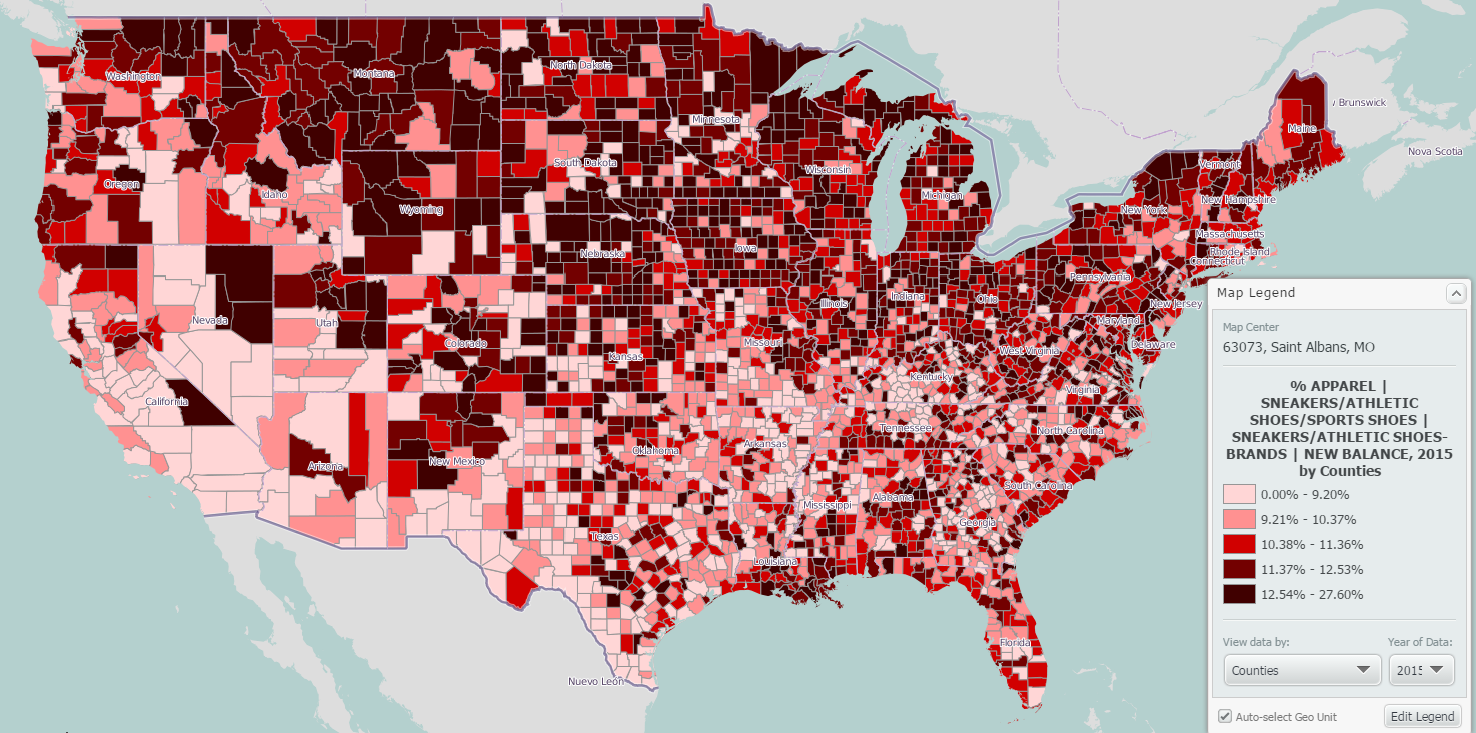
New Balance
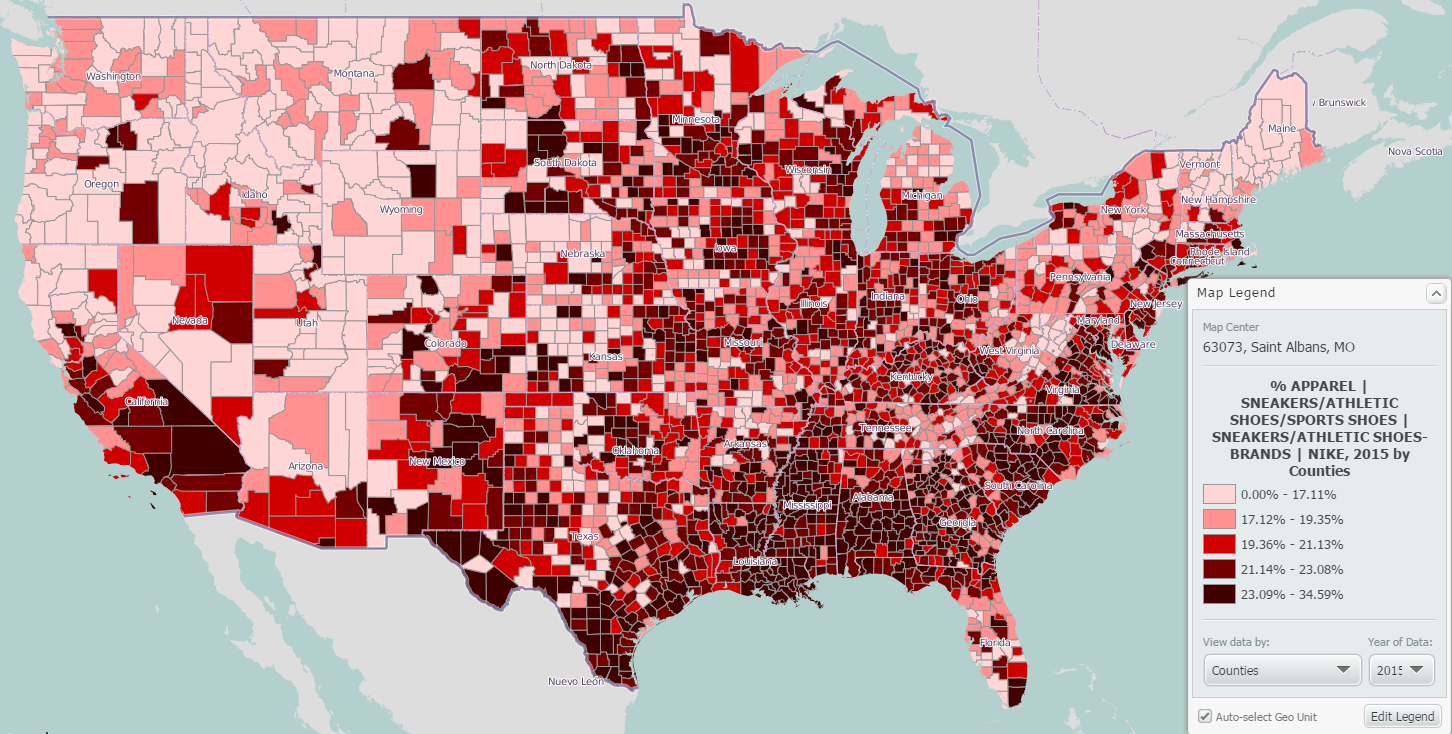
Nike
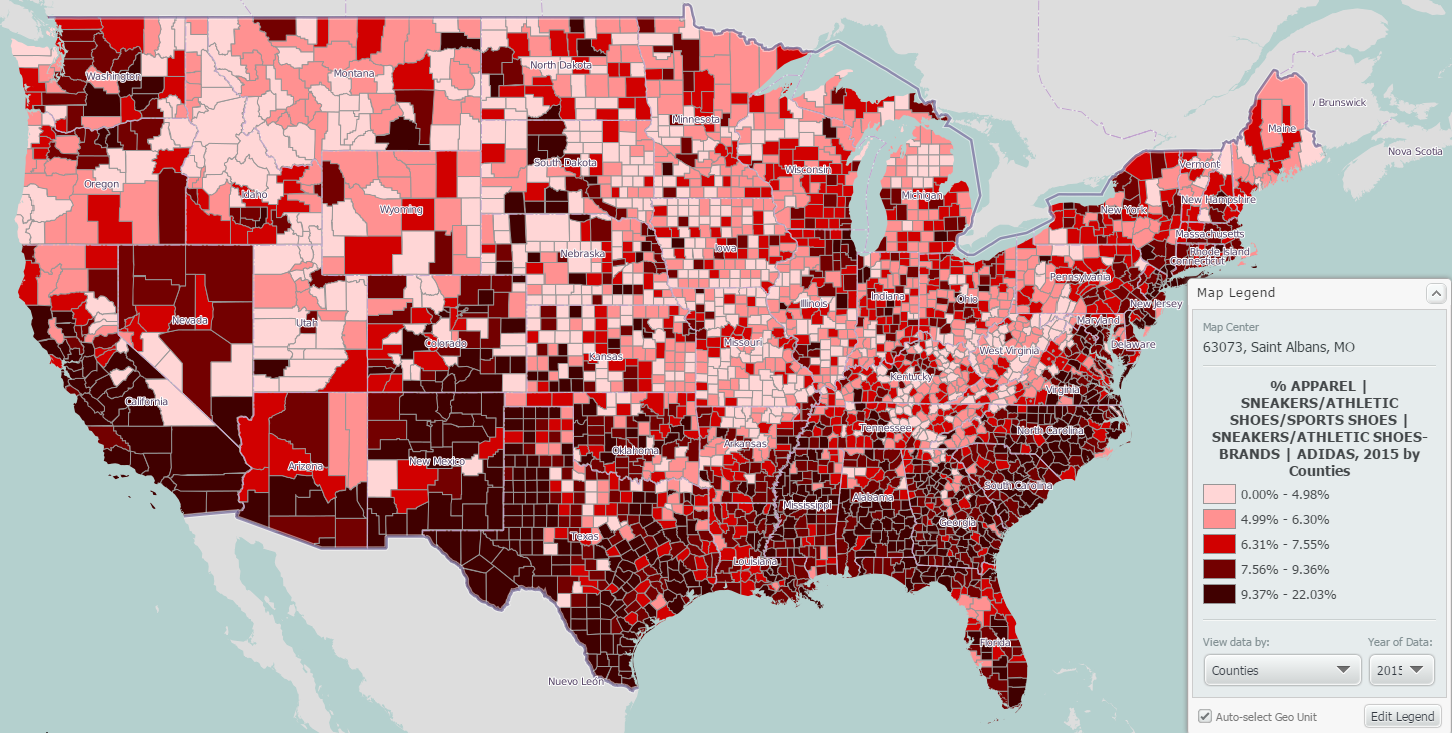
Adidas
A few interesting takeaways from these maps:
1. New Balance is popular amongst the northern half of the US
2. Folks in the south east love their Nikes
3. Adidas dominates the southern portion of the US, including the south west
Can you think of any other brands of items you would like to see mapped? The SimmonsLOCAL data set contains 8,000 specific brands, it is very possible that we have the data you are looking for. Let us know in the comments below!
More from SimplyAnalytics
Posted on Mar 30, 2016 by Admin
In previous blog entries we highlighted the usefulness of viewing multiple years of data for the same variable. In short, analyzing the same variable across multiple years allows users to...
Posted on Feb 16, 2009 by Admin
Men's Health conducted their first survey of America's recycling habits, and used SimplyMap in their research. Here’s how the editors explain their methodology: To determine how well citi...
Posted on Feb 21, 2018 by Admin
We are looking forward to attending our first Electronic Resources & Libraries (ER&L) conference in Austin, TX! Visit us at Table #510 for a closer look at SimplyAnalytics – the b...
Posted on Dec 11, 2023 by Admin
Hello readers! We have some fantastic news to share. SimplyAnalytics is thrilled to announce the addition of 2020 Election data to our expanding collection of powerful datasets. With this...
Posted on Dec 09, 2014 by Admin
In this week’s SimplyMap blog post, we set out to discover which large US cities spend the most money per year on their pets. To find this out we used the variable, “Pets, Household Avera...
Posted on Dec 19, 2016 by Admin
Stop by the Geographic Research booth [#T8] at the Ontario Library Association Super Conference to get a hands-on look at our latest and greatest SimplyMap offering. The conference will t...
Posted on Feb 24, 2019 by Admin
We will be exhibiting at SCELC* Vendor Day on March 14th. Visit us at table 510 and attend one of our two sessions demonstrating SimplyAnalytics. The presentations will highlight newly av...
Posted on Apr 23, 2018 by Admin
Hello everyone and welcome to this week’s blog. This week we will discuss how to create and utilize filters for your research. Why Use a Filter? Filters are a great way to identify target...
Posted on Dec 03, 2012 by Admin
Come visit the Geographic Research booth at the Ontario Library Association Super Conference this season. The conference will take place on January 30 - February 2, 2013 at the Metro Toro...
Posted on Aug 30, 2009 by Admin
Jeff Zaslow, Wall Street Journal columnist and co-author of the The Last Lecture, will speak at the Orlando, FL Public Library on Friday, September 11 at 7 p.m. Zaslow helped the late Ran...