


Exploring SimplyMap Data - Organic Food Use
Posted on Mar 03, 2016 by Admin
In this week’s SimplyMap report we take a look into the SimmonsLOCAL dataset to determine which cities in America have the highest percentage of residents who consume organic food products. Let’s jump right in.
Before we rank the variable, % FOOD - GENERAL | ORGANIC FOODS | ORGANIC FOODS - HH USES? | YES, 2014 let’s do a quick search for “organic” to see how many related variables are in SimplyMap. Open the Variables tab, click on Search, and type in “organic”.
You will then get a list of all variables in SimplyMap that contain the keyword organic.
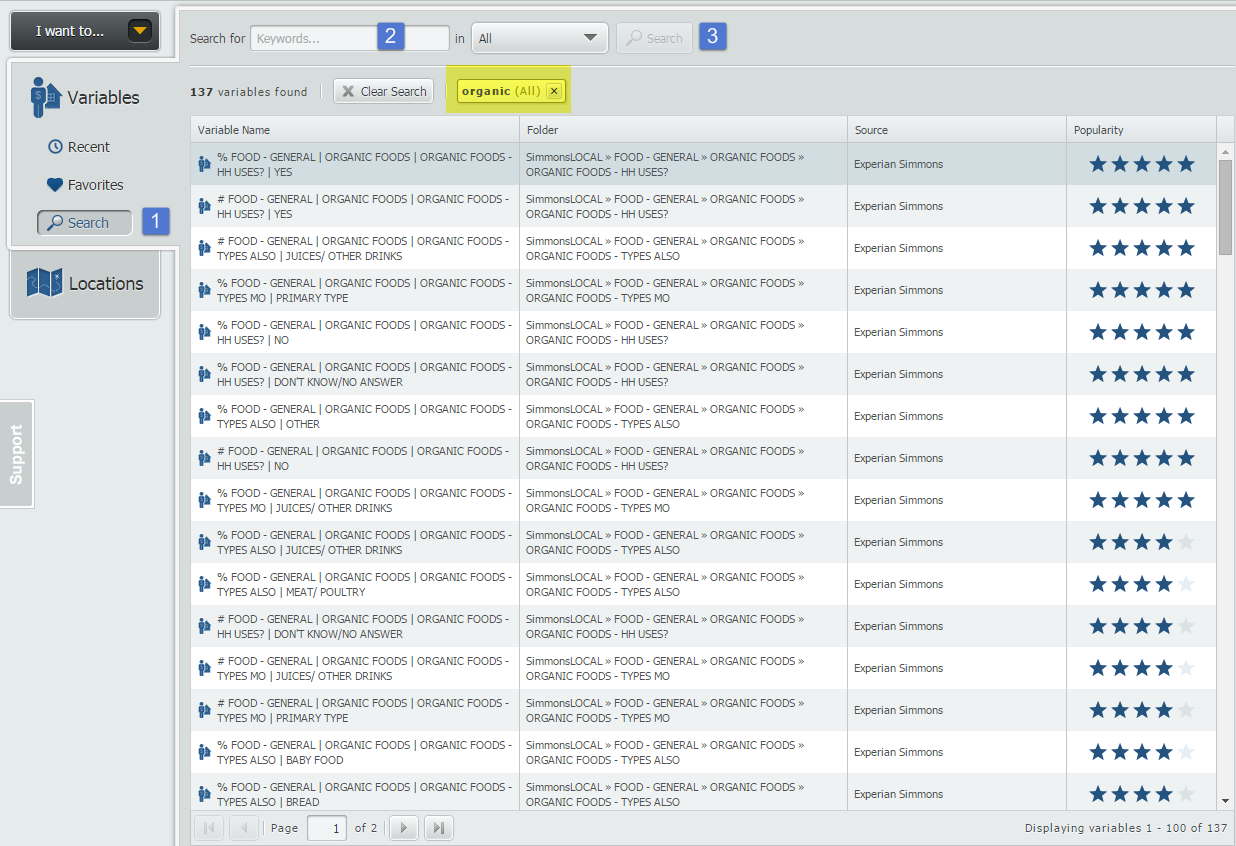
SimplyMap has a grand total of 137 “organic” associated variables across all datasets (the majority being within the SimmonsLOCAL package) with variables such as organic bread, and organic baby food use. Interesting!
It’s helpful to see what the US percentage is for our organic usage variable. This will help get a sense of the cities compare to the national total. Create a Standard Report with the US as your location, and the variable % FOOD - GENERAL | ORGANIC FOODS | ORGANIC FOODS - HH USES? | YES, 2014.
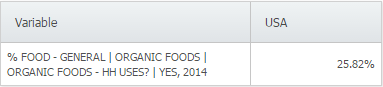
It looks like roughly one-quarter of the US claim to consume organic foods. On to the ranking.
Click on New Ranking at the top of SimplyMap. Next, select Recent from the Variables panel to quickly find and rank the variable used above. Lastly, set the Analyze Data By dropdown to Cities. Results below!
Note: We applied a population filter of > 200,000 residents to remove any percentages that might be unusually high due to a small population total.
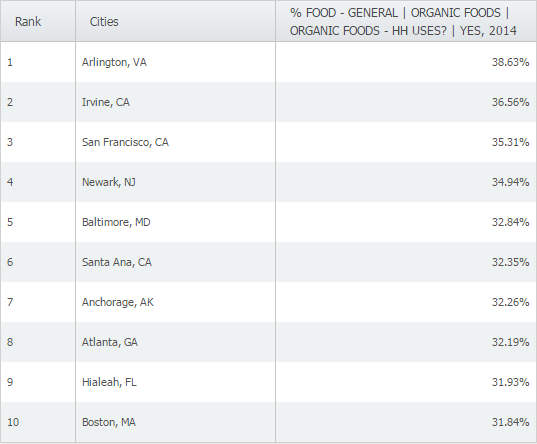
Any surprises in the results above?
We hope you enjoyed this week’s SimplyMap report. Stay tuned for more!
More from SimplyAnalytics
Posted on Apr 30, 2024 by Admin
Congratulations to Brandyn Whitaker as the recipient of the 2024 BRASS Student Travel Award! Brandyn is a Library Services Associate in the Workforce and Economic Development department a...
Posted on Sep 15, 2016 by Admin
While creating a radius location is the fastest and easiest method for creating a custom location, there may be situations that require a more specific and targeted locale. Let’s say for ...
Posted on Feb 20, 2018 by Admin
We are looking forward to attending the annual SCELC (Statewide California Electronic Library Consortium) Vendor day, at Loyola Marymount University in Los Angeles on March 8th. In additi...
Posted on Oct 30, 2018 by Admin
We are pleased to be exhibiting at this year's 30th Annual Charleston Library Conference! The Charleston Vendor Showcase will be held Tuesday, November 6, 2018, from 10:30 a.m. to 6:00 p....
Posted on Nov 28, 2012 by Admin
Come visit the SimplyMap team at the ALA Midwinter Meeting, January 25 - 28, 2013 in Seattle, WA. We will be in Booth 1307, and as always we look forward to meeting with customers new and...
Posted on Feb 24, 2019 by Admin
We will be exhibiting at SCELC* Vendor Day on March 14th. Visit us at table 510 and attend one of our two sessions demonstrating SimplyAnalytics. The presentations will highlight newly av...
Posted on Mar 02, 2015 by Admin
In this week’s SimplyMap tip, we outline the process of creating a radius location. Radius locations are a great way to quickly gather information from an area surrounding a target addres...
Posted on Dec 03, 2015 by Admin
With the Thanksgiving holiday last week, we decided to take a quick look into SimplyMap to see what pertinent variables are available for analysis. First, open the Variables panel and cli...
Posted on Jul 14, 2009 by Admin
Men's Health continues to utilize SimplyMap to identify and rank U.S. cities. This time they are studying "sports-obsessed citizenry," and here is how they did it: Our stat showdown began...
Posted on May 25, 2010 by Admin
We will be exhibiting at the 2010 SLA Annual Conference & INFO-EXPO June 13-15 at the Ernest N. Morial Convention Center in New Orleans, LA. Join us at booth 1537 - bring your quest...