


Exploring SimplyMap Data: America’s Bookworms
Posted on Jan 27, 2015 by Admin
In this week’s report exploring SimplyMap data, we take a look at where America’s bookworms reside. To find this data, we used the variable, Reading (Household Average), 2014 found in the Consumer Expenditure folder. This variable encompasses all expenses used on magazine subscriptions, newspaper subscriptions, and books.
To make this report, we chose to utilize a Ranking Report. First, we took a look at the top 10 states:
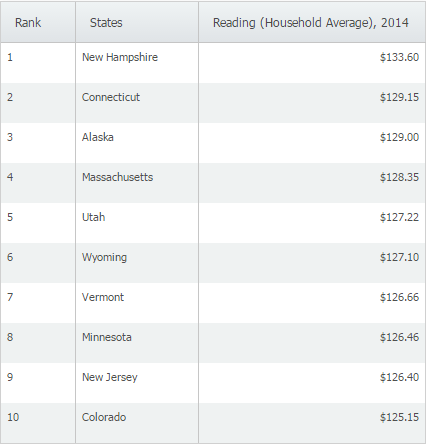
At a yearly household average of $133.60, the state of New Hampshire ranks first in the United States in spending on reading material. For reference, the United States at large totaled $116.85. Next, we applied a data filter to view cities with a population of more than 75,000. The results are as follows:
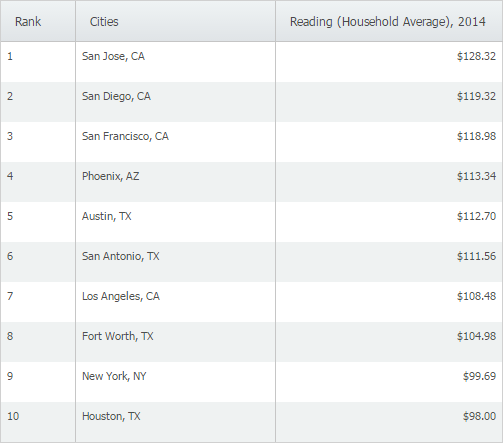
San Jose, CA ranks first in the United States for household spending on reading materials. California is also well represented in the top 10 with San Diego (2), San Francisco (3), and Los Angeles (7) also ranking in the top 10.
Stay tuned for more SimplyMap data reports and tips!
More from SimplyAnalytics
Posted on Dec 15, 2014 by Admin
Custom Locations allow SimplyMap users to combine several locations into one larger region. For example, you can use this feature to combine three adjacent ZIP Codes to create your study ...
Posted on Nov 22, 2016 by Admin
We will be exhibiting at ALA Midwinter in Atlanta, Georgia in January. You can find the GRI team at Booth 1155, where we will be catching up with customers old and new, and sharing some e...
Posted on May 25, 2010 by Admin
We will be exhibiting at the 2010 SLA Annual Conference & INFO-EXPO June 13-15 at the Ernest N. Morial Convention Center in New Orleans, LA. Join us at booth 1537 - bring your quest...
Posted on May 06, 2013 by Admin
The GRI team is looking forward to exhibiting at SLA 2013 at the San Diego Convention Center, June 9th through the 11th. The Special Libraries Association (SLA) is a nonprofit global orga...
Posted on Nov 19, 2019 by Admin
Hello readers! Today we are bringing you a new blog entry inspired by a recent Help Desk question. If you ever have any questions about SimplyAnalytics, please do not hesitate to reach ou...
Posted on Apr 05, 2019 by Admin
Come visit the SimplyAnalytics booth (325) at the upcoming ACRL 2019 show in Cleveland! Say hello, grab a chocolate, and stay for a quick demo of SimplyAnalytics. The team will be showcas...
Posted on Mar 10, 2011 by Admin
The GRI team is looking forward to exhibiting at ACRL 2011 at the PA Convention Center in Philadelphia, March 30 - April 1, 2011. Every other year, ACRL offers its premier professional d...
Posted on Oct 08, 2008 by Admin
Geographic Research, Inc. (GRI) is pleased to sponsor the fourth annual American Collegiate Retailing Association’s Undergraduate Student Retail Analysis Competition. This is the second ...
Posted on Feb 21, 2018 by Admin
We are looking forward to attending our first Electronic Resources & Libraries (ER&L) conference in Austin, TX! Visit us at Table #510 for a closer look at SimplyAnalytics – the b...
Posted on May 23, 2019 by Admin
Come visit the SimplyAnalytics team at the Special Library Association's Annual Conference in Cleveland. Special librarians and other information professionals come together at SLA’s annu...