


American Community Survey Data in SimplyAnalytics
Posted on Jun 21, 2022 by Admin
Hello readers! We hope you’re having a great day. Today we are featuring 5 commonly asked questions about the American Community Survey dataset that’s available to all customers in SimplyAnalytics. Let’s get started.
What is the American Community Survey?
The American Community Survey (ACS) is an ongoing monthly/annual survey of over 3.5 million households in the US conducted by the U.S. Census Bureau. The ACS asks questions about topics such as education, employment, internet access, transportation, disability and more. These topics and the reported answers are useful to understand communities, and to help determine funding/programming needs. Here’s a wonderful explanation of why the ACS asks about each of these topics: https://www.census.gov/acs/www/about/why-we-ask-each-question/
What Years are Available in SimplyAnalytics?
Every SimplyAnalytics user has access to the following years of ACS data: 2010, 2011, 2012, 2013, 2014, 2015, 2016, 2017, 2018, 2019, 2020 (estimate), 2021 (estimate), 2025 (projection), 2026 (projection).
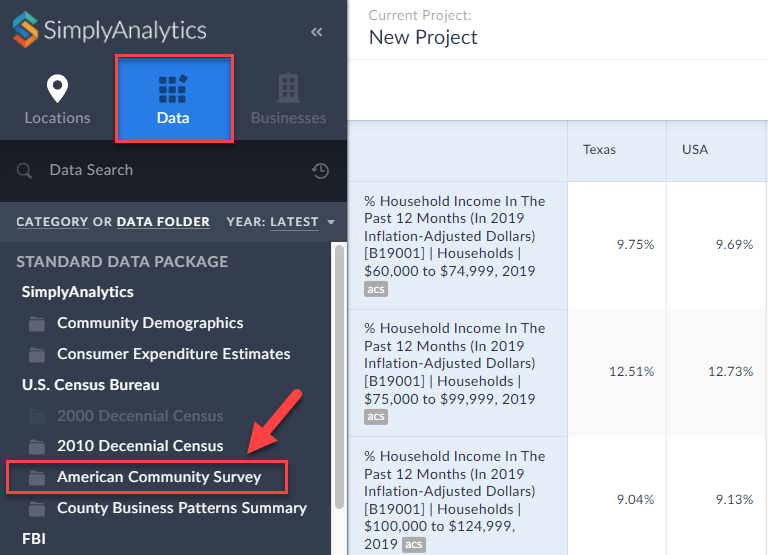
How can I access the ACS data in SimplyAnalytics?
You can jump directly to the ACS data folder by clicking on Browse by Data Folder from within the Data block at the top left of SimplyAnalytics.
 What type of data is available in the ACS?
Each year of the ACS includes thousands of data variables for users to choose from. Below is a list of the main topics - note that many of the folders below contain multiple subfolders.
What type of data is available in the ACS?
Each year of the ACS includes thousands of data variables for users to choose from. Below is a list of the main topics - note that many of the folders below contain multiple subfolders.
What type of data is available in the ACS?
Each year of the ACS includes thousands of data variables for users to choose from. Below is a list of the main topics - note that many of the folders below contain multiple subfolders.
- Age; Sex
- Race
- Hispanic or Latino Origin
- Ancestry
- Citizenship Status; Year of Entry; Foreign Born Place of Birth
- Place of Birth
- Migration/Residence 1 Year Ago
- Commuting (Journey to Work); Place of Work
- Relationship to Householder
- Grandparents and Grandchildren Characteristics
- Household Type; Family Type; Subfamilies
- Marital Status; Marital History
- Fertility
- School Enrollment
- Educational Attainment; Undergraduate Field of Degree
- Language Spoken at Home
- Poverty Status
- Disability Status
- Income
- Earnings
- Veteran Status; Period of Military Service
- Food Stamps/Supplemental Nutrition Assistance Program (SNAP)
- Employment Status; Work Status Last Year
- Industry, Occupation, and Class of Worker
- Housing Characteristics
- Group Quarters
- Health Insurance Coverage
- Computer and Internet Use
- Citizen Voting-Age Population
- Quality Measures
- Allocation Table for Any Subject
- Map View: Create a map of a city, and visualize the Census Tracts by % of households that have moved in within the past year from a different state
- Ranking Report: Rank the ZIP Codes in a state with the highest % of households who do not have a computer
- Comparison Report: Research disability data in your home Census Tract, and compare that data with the ZIP Code, County, State, and US.
More from SimplyAnalytics
Posted on Sep 05, 2019 by Admin
SimplyAnalytics will be exhibiting at the biennial North Carolina Library Association conference, to be held this year at the Winston-Salem Benton Convention Center. If you are attending,...
Posted on Nov 11, 2013 by Admin
Chad Boeninger, Business & Economics Subject Specialist at Ohio University Libraries has produced some excellent tutorial videos to help students learn how to analyze data and create ...
Posted on Mar 02, 2009 by Admin
ACRL's 14th National Conference will be held at the Washington State Trade and Convention Center in downtown Seattle, March 12-15, 2009. Every other year, ACRL offers its premier profe...
Posted on Oct 29, 2015 by Admin
Did you know that SimplyMap allows you to search for businesses by NAICS or SIC codes? Searching by these codes is a great alternative to the general keyword search. Using the keyword sea...
Posted on Feb 27, 2015 by Admin
SimplyMap is an excellent tool for market research, and it’s made even more powerful by Nielsen PRIZM data. Nielsen PRIZM is the highest quality market segment data available. Every house...
Posted on Jul 20, 2020 by Admin
Hello readers! We hope you are doing well and staying safe. Today we are excited to introduce the Simmons NCS crosstabs functionality! This is a feature we’ve been working on for a while,...
Posted on Apr 17, 2018 by Admin
The SimplyAnalytics team would like to congratulate Rachel Holder, MLS candidate at Indiana University for being selected as this year's recipient of the BRASS Student Travel Award! ...
Posted on Jul 30, 2015 by Admin
One great feature within SimplyMap is the ability to track the same variable across multiple years. In this report, we will track the percentage of households in the US ordering items fro...
Posted on Sep 28, 2018 by Admin
Welcome readers! Today we have a quick feature highlight that will assist you in browsing and searching for data variables. All data variables have a path where they reside within their d...
Posted on Dec 15, 2014 by Admin
Stop by the Geographic Research booth at the Ontario Library Association Super Conference to check out SimplyMap Canada. The conference will take place January 28-31 at the Metro Toronto ...