


Introducing Election Data
Posted on Dec 11, 2023 by Admin
Hello readers! We have some fantastic news to share. SimplyAnalytics is thrilled to announce the addition of 2020 Election data to our expanding collection of powerful datasets. With this latest update, you can now gain deeper insights into the electoral landscape of the United States, and best of all - this dataset is free and available now for all SimplyAnalytics customers! Let's delve into the significance of this update.
 Explore the 2020 Election Data:
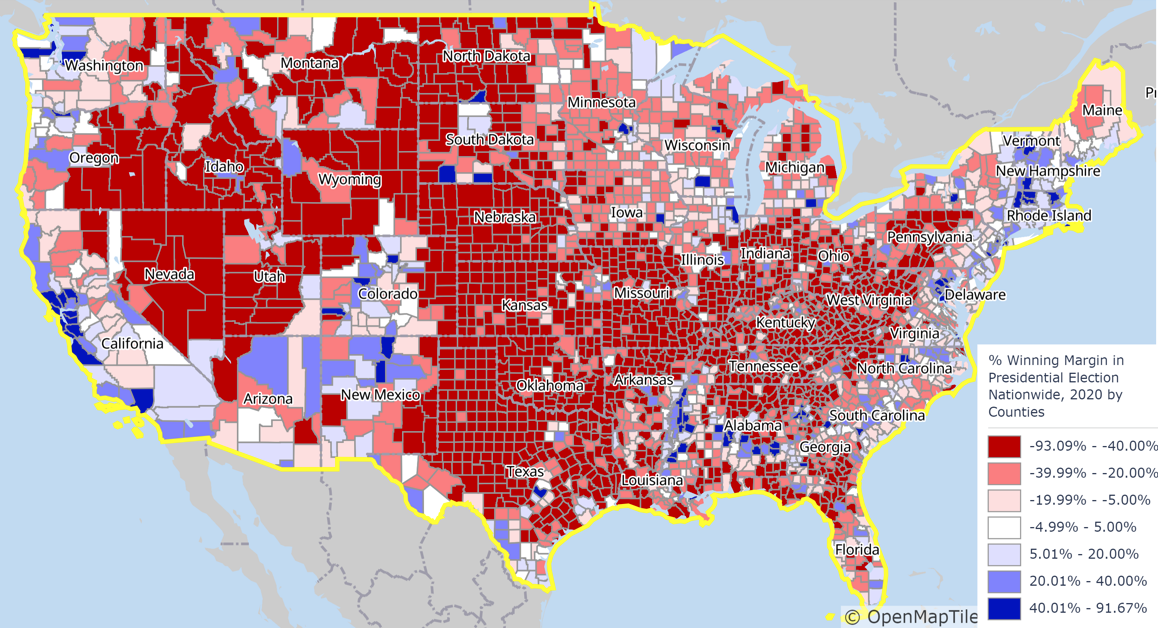
With the inclusion of 2020 Election data in SimplyAnalytics, you can access a comprehensive range of election information. Dive into county-level voting results for:
- Presidential (Winning margin, Democrat votes, Republican votes)
- US Senate (Winning margin, Democrat votes, Republican votes)
- US House (Winning margin, Democrat votes, Republican votes)
- Governor (Winning margin, Democrat votes, Republican votes)
You will also have the opportunity to analyze specific candidates in state-wide elections. For example, votes for Jon Ossoff versus David Perdue for the counties in Georgia or John Rutherford versus Donna Deegan in Florida’s 4th Congressional District.
Gain Actionable Insights & Commingle Data for a Holistic Picture:By analyzing 2020 Election data in SimplyAnalytics, you can identify voting patterns, assess the influence of different demographics, and uncover trends that shaped the final outcome.
With our intuitive mapping and visualization tools, you can also easily transform this raw 2020 Election data into visually engaging and easy-to-understand maps, charts, and graphs.
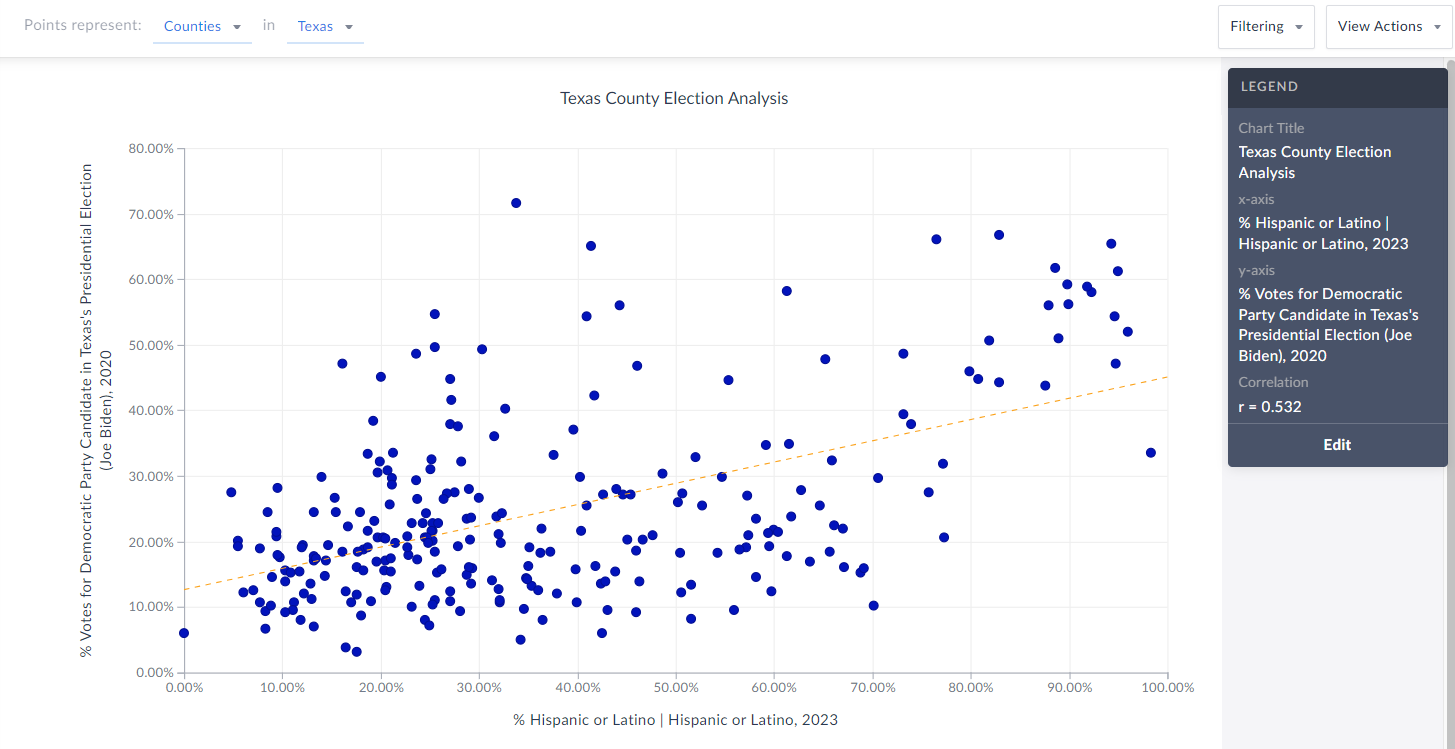
Of course, SimplyAnalytics also has the ability to combine datasets seamlessly. By co-mingling 2020 Election data with other demographic, marketing, psychographic or even health datasets, you can create a holistic picture of the election's results. For example, you can explore correlations between voting patterns and income levels or lifestyle data.
The addition of 2020 Election data to SimplyAnalytics is an exciting milestone, opening up new possibilities for exploration and analysis. Whether you are a researcher, student, business professional, or a data enthusiast, this update is sure to provide a valuable resource for better understanding the 2020 U.S. Presidential Election.
Log in to SimplyAnalytics now and start exploring. Have fun!
More from SimplyAnalytics
Posted on Nov 28, 2023 by Admin
Hello readers! We are happy to announce that SimplyAnalytics has successfully migrated to the Census 2020 boundaries on Sunday, November 19th. This blog will talk about what that is, what...
Posted on Sep 01, 2008 by Admin
The King County Library System in Washington State now subscribes to SimplyMap, and has published a brief review on their blog, Library Talk.
Posted on May 06, 2013 by Admin
The GRI team is looking forward to exhibiting at SLA 2013 at the San Diego Convention Center, June 9th through the 11th. The Special Libraries Association (SLA) is a nonprofit global orga...
Posted on Apr 21, 2015 by Admin
In this week’s edition of exploring SimplyMap data, we spotlight the Consumer Buying Power® data package in SimplyMap. What is it? The Nielsen Consumer Buying Power® database incorporates...
Posted on Jan 29, 2016 by Admin
In a previous blog entry, we highlighted the benefits of having multiple years of data available for the same variable. This allows users to identify trends over time. Keeping with the sa...
Posted on May 26, 2016 by Admin
In this week’s report exploring SimplyMap data, we take a look at the variables available relative to internet search engines used. The source of this data will come from the SimmonsLOCAL...
Posted on Sep 05, 2019 by Admin
SimplyAnalytics will be exhibiting at the biennial North Carolina Library Association conference, to be held this year at the Winston-Salem Benton Convention Center. If you are attending,...
Posted on Nov 11, 2014 by Admin
With Veteran’s Day in the US this week, we thought it would be an ideal time to explore some of the variables in SimplyMap that pertain to veterans. Specifically, we wanted to know which ...
Posted on May 23, 2012 by Admin
We will be exhibiting at the Special Libraries Association (SLA) annual conference and Info-Expo at McCormick Place in Chicago Sunday June 15th - Tuesday July 17th. Visit us at Booth 124 ...
Posted on Sep 28, 2018 by Admin
Welcome readers! Today we have a quick feature highlight that will assist you in browsing and searching for data variables. All data variables have a path where they reside within their d...