 Go up
Go up


American Household Spending on Pets
Posted on Dec 09, 2014 by Admin
In this week’s SimplyMap blog post, we set out to discover which large US cities spend the most money per year on their pets. To find this out we used the variable, “Pets, Household Average” found in the consumer expenditure category in SimplyMap.
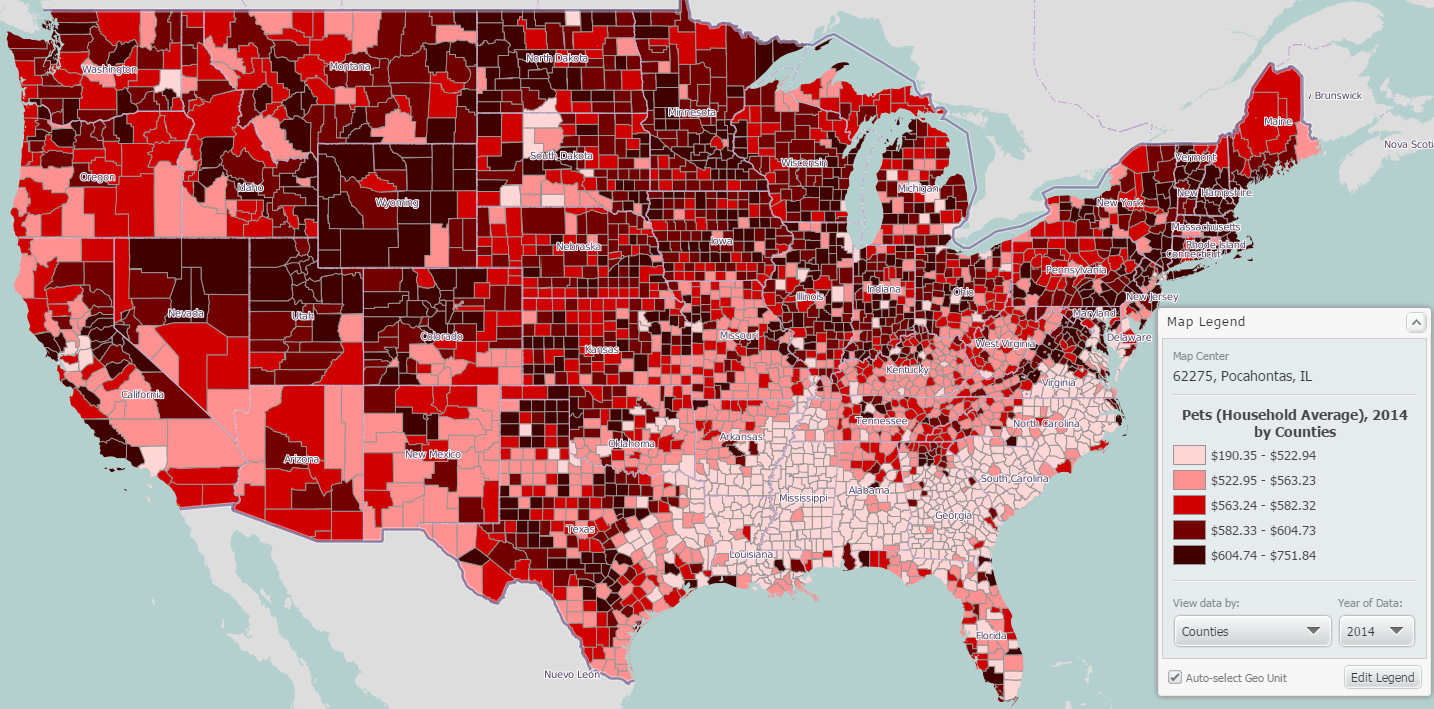
The national quantiles (by counties) in our legend ranged from a low of $190.35 to a high of $751.84. Using the “Create Ranking from Map” feature, we were presented with the following unfiltered results:
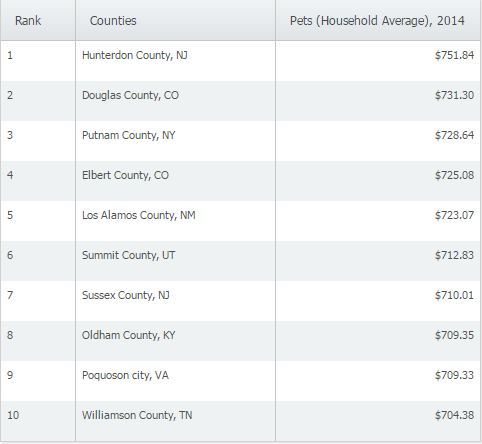
Creating a ranking report from a map using the US as the location will present county level data by default. Because we wanted to find larger US cities, we had to do two things: change the geography that the data was analyzed by, and create a population filter to show cities with a population greater than 100,000.
Changing How the Data is Analyzed
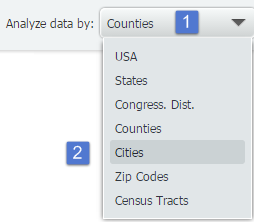
Changing the geographies of your ranking report is a simple two step process. First, select the “analyze data by” drop down menu and then select a new geographic unit. SimpyMap will present your new data immediately.
Creating and Applying a Filter
To create and apply a filter to only show cities with a population > 100,000:
Select “Data filters” then “Create new filter” from the top right of your screen.
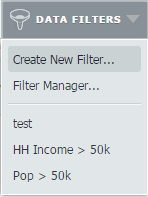
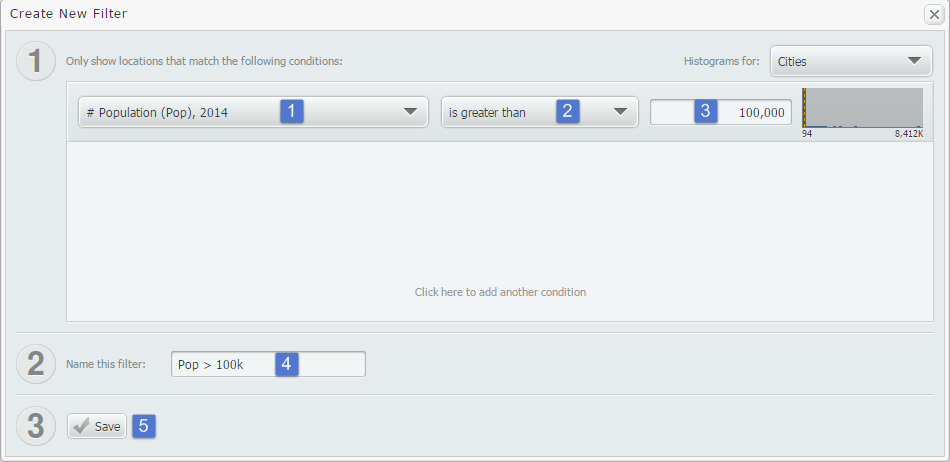
At the filter creation screen, we used a recent variable # Population. We then set the condition to be greater than and typed in the value of 100,000. Lastly, we created a name and saved the filter.
Final Results Presented
Using the Display Options menu located near the top right of SimplyMap, we chose to hide results that did not meet our criteria of a city population greater than 100,000. The final results are below:
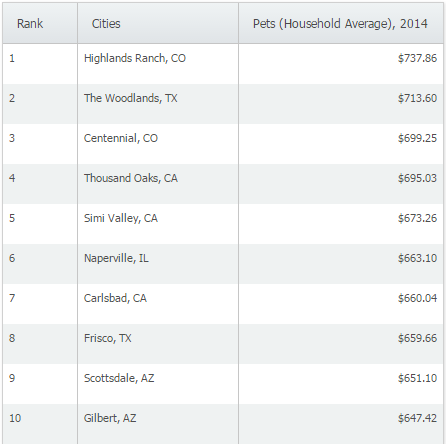
At a yearly average of $737.86, Highlands Ranch, CO ranks #1 in the United States in yearly average household spending on pets.
Stay tuned for more reports and SimplyMap tips & tricks!
More from SimplyAnalytics


Posted on Oct 16, 2015 by Admin
Did you know that SimplyMap includes the ability to export Shapefile data for use in desktop mapping software (such as MapInfo or ArcGIS)? This advanced feature extends the power of Simpl...
Posted on May 10, 2016 by Admin
One benefit of data and applications like SimplyMap is the ability to visualize information. In this week’s report, we’ll take a quick look at some branding preferences in contiguous Amer...
Posted on Oct 29, 2015 by Admin
Did you know that SimplyMap allows you to search for businesses by NAICS or SIC codes? Searching by these codes is a great alternative to the general keyword search. Using the keyword sea...
Posted on Apr 05, 2019 by Admin
Come visit the SimplyAnalytics booth (325) at the upcoming ACRL 2019 show in Cleveland! Say hello, grab a chocolate, and stay for a quick demo of SimplyAnalytics. The team will be showcas...
Posted on Mar 09, 2010 by Admin
The GRI team will be exhibiting at the 2010 Public Library Association conference later this month at the Oregon Convention Center in Portland, OR. The PLA National Conference is the prem...
Posted on Apr 30, 2024 by Admin
Congratulations to Brandyn Whitaker as the recipient of the 2024 BRASS Student Travel Award! Brandyn is a Library Services Associate in the Workforce and Economic Development department a...
Posted on Jan 07, 2015 by Admin
In this week’s exploration of SimplyMap data, we set out to find which cities in the United States have the highest percentage of older houses. To determine this, we used the variable “% ...
Posted on Jul 28, 2013 by Admin
We recently discovered some interesting data on participation and attitudes towards recycling, and decided to dig a bit deeper into our Experian SimmonsLOCAL data. This data package inclu...
Posted on Jul 22, 2015 by Admin
In this week’s SimplyMap report, we take a look at one of our newly available data packages - ConneXions® from Nielsen. The ConneXions® segmentation system integrates consumer behavior an...
Posted on Dec 02, 2014 by Admin
Today we take a look at one of the more advanced features in SimplyMap - editing the map legend. Editing the map legend is a great way to not only customize how the data is distributed on...