


Feature Highlight: Data Filters
Posted on Apr 23, 2018 by Admin
Hello everyone and welcome to this week’s blog. This week we will discuss how to create and utilize filters for your research.
Why Use a Filter?
Filters are a great way to identify target areas that meet multiple conditions.
Use Case
You want to identify areas of San Antonio to market your afterschool program that is aimed towards low income and low educational attainment areas. You can use a data filter to help find the target areas.
Example
First, we will identify the target areas by creating an income filter and mapping the education attainment variable. Let’s get started.
1.Create the project by entering the target location for analysis in the Location field. In this example, the city of San Antonio, TX.
2. Map the variable % Education, College, Masters or Doctorate Degree. This is one of the 3 default data variables available when creating a project.
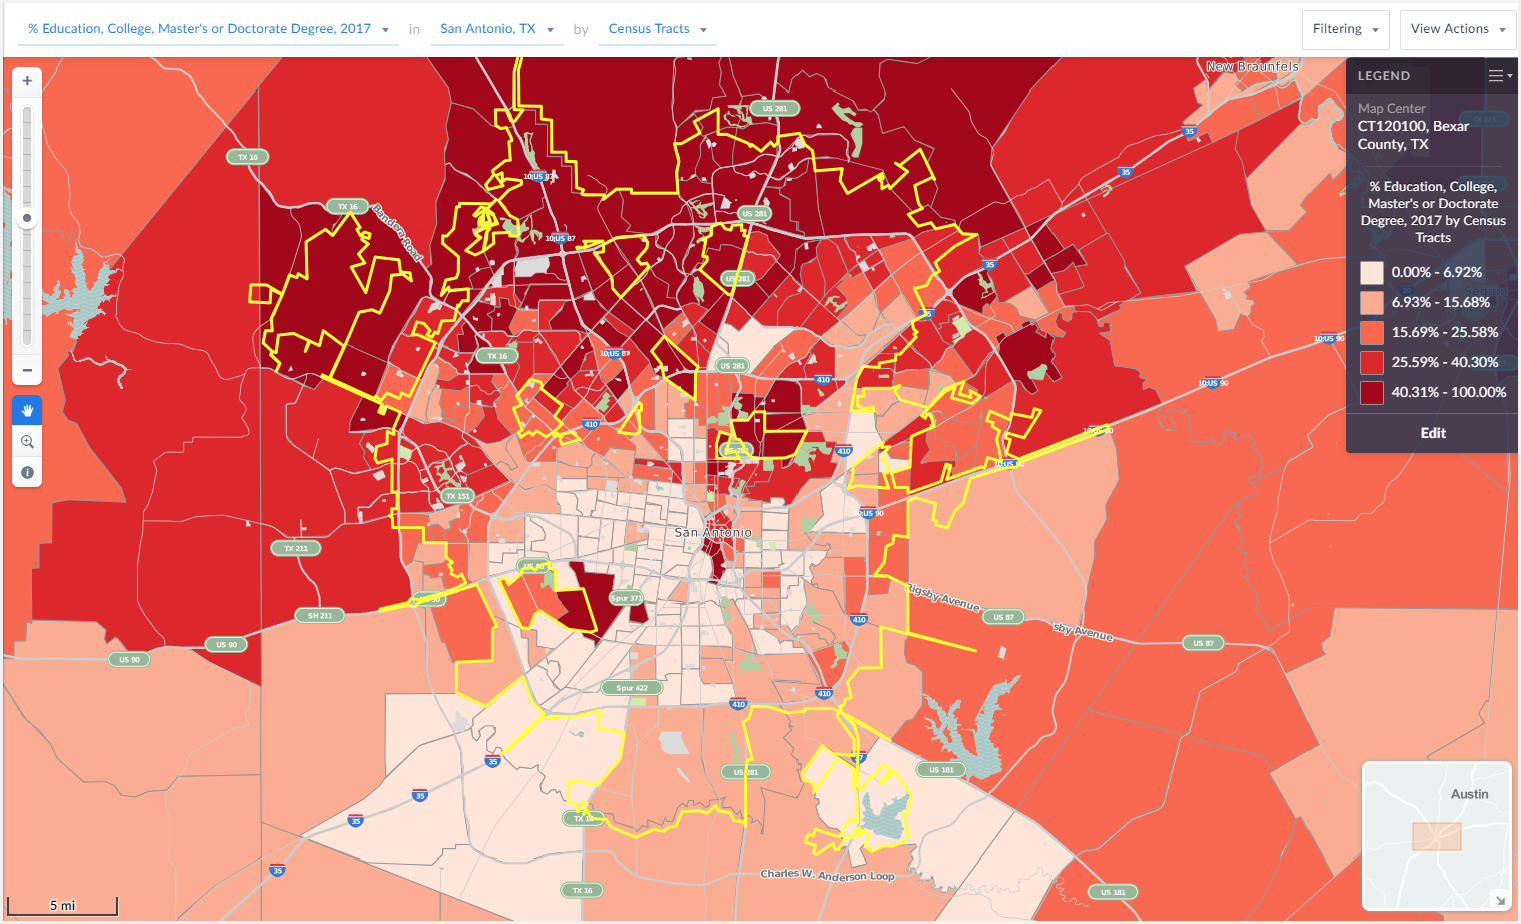
The darker areas of the map represent highly educated areas whereas the lighter areas reflect areas where a smaller percentage of residents have a college degree.
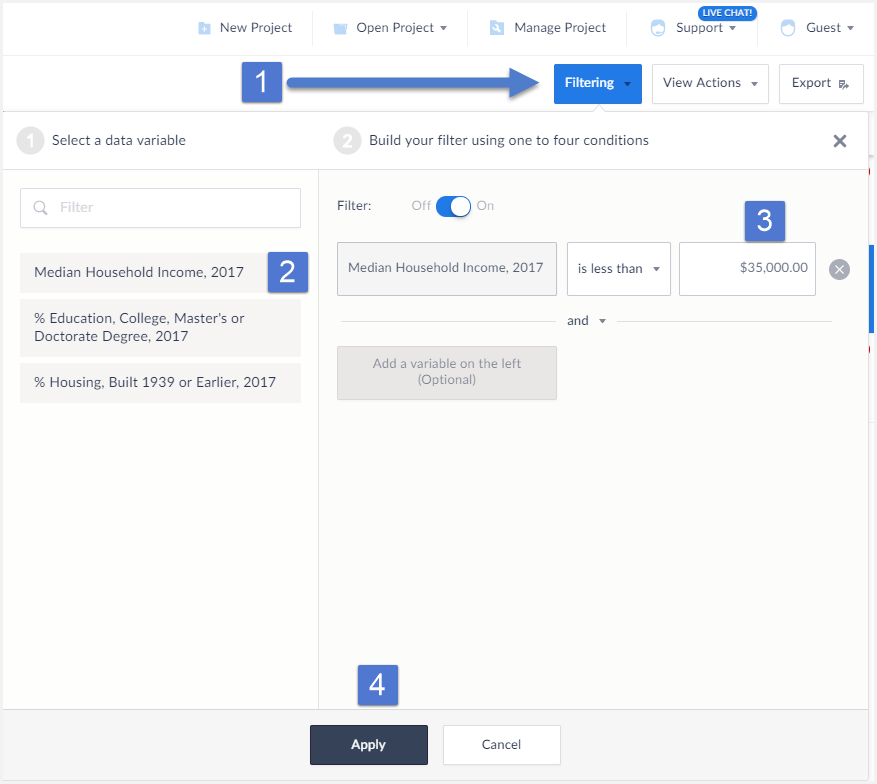
Next, create the income data filter.
- Select Filtering from the top Right of the interface. This will bring up the filter menu.
- Select a variable to act as a condition, in this example we want the Median Income variable.
- Enter a value for the condition (less than $35,000) and select Apply.
The filter gets applied to your map.
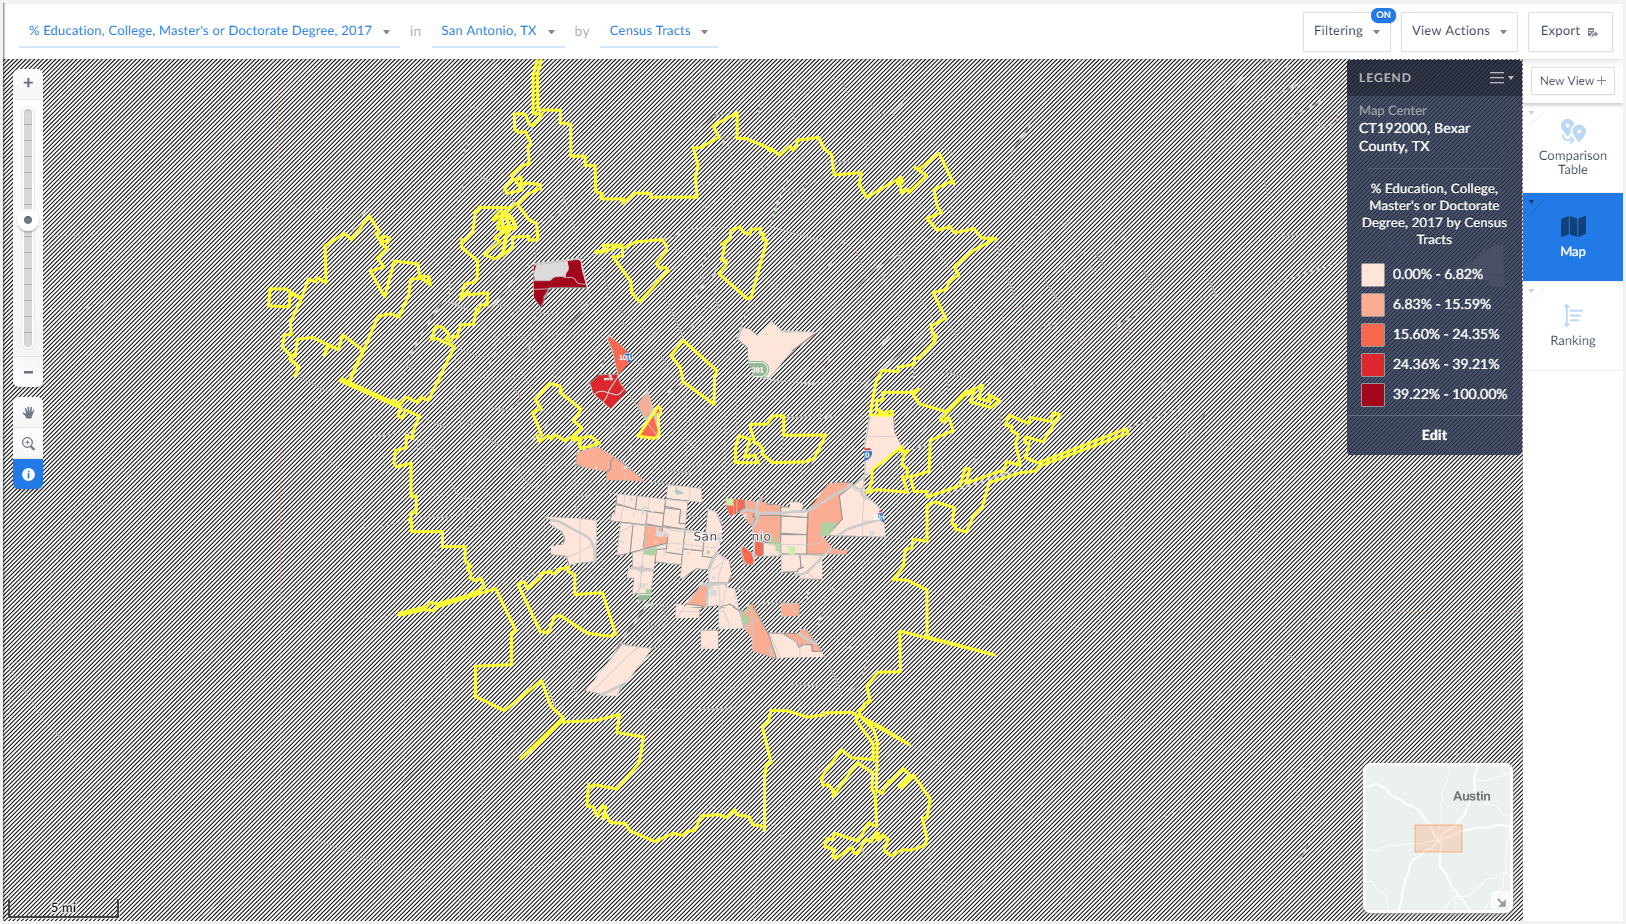
The final map image above reveals Census Tracts that meet our income criteria - looking at the still visible mapped areas provides the user with some ideal locations to market their program to.
That’s it for this week’s report! Stay tuned for more SimplyAnalytics how-tos and tips and send us your questions at support@simplyanalytics.com. If we feature your question in a future blog post, we’ll treat you to a $10 Starbucks gift card!
More from SimplyAnalytics
Posted on Oct 23, 2009 by Admin
SimplyMap was highlighted in the Wake County, NC Public Library Business Blog today as a valuable tool for business planning. Wake County has access to SimplyMap through NC LIVE, a statew...
Posted on May 02, 2016 by Admin
Inspired by a recent support desk question, this week’s SimplyMap report will demonstrate how a user would run a business search that consists of multiple names. In short, the user was at...
Posted on Dec 15, 2014 by Admin
Visit the SimplyMap team at the ALA Midwinter Meeting in Chicago late January. We will be at booth #2824 offering product demonstrations, tips & tricks, and of course Ghirardelli Choc...
Posted on Jul 30, 2018 by Admin
Hello readers! Welcome to this week’s blog. This week we will feature the Related Data Table view and how you can use it to maximize your productivity in SimplyAnalytics. What is it? The ...
Posted on Aug 20, 2015 by Admin
Is there a specific age group and income bracket you are specifically interested in researching for a target location? Our Life Stages module has the information you need. Life Stages, by...
Posted on Mar 04, 2020 by Admin
Come meet the SimplyAnalytics team at the 15th annual Electronic Resources and Libraries conference, held at the AT&T Hotel & Conference Center in Austin, TX. We will be exhibitin...
Posted on Mar 03, 2016 by Admin
In this week’s SimplyMap report we take a look into the SimmonsLOCAL dataset to determine which cities in America have the highest percentage of residents who consume organic food product...
Posted on Jul 24, 2013 by Admin
Registration is now open for the North Carolina Library Association Conference! Visit us at the 60th biennial conference (Booth #45) through October 15 - 18, 2013. We have beautiful ca...
Posted on Mar 21, 2018 by Admin
The Quick Report is one of the newest features added to SimplyAnalytics - let’s take a look at how it can support your research. This report instantly provides you with a curated list of ...
Posted on Jun 02, 2017 by Admin
We will be exhibiting at SLA in Phoenix, AZ on June 18th-20th. You can find the SimplyAnalytics team at Booth #905. Stop by and check out our groundbreaking new interface, have a chocolat...