


Managing Projects in SimplyAnalytics
Posted on Dec 08, 2017 by Admin
Good afternoon, readers! This week we’re going to talk about project management in SimplyAnalytics and how to best take advantage of it.
Why are projects needed?
Many users have multiple unique projects going on at the same time. For example, you could be doing: personal research, patron/student assistance, research for a presentation, etc. Projects help keep these unique activities separate from one another to avoid confusion.
What is stored in each project?
All of the locations, variables, business searches, favorites, views, etc. that you use are saved with the project - so each time you login, you can pick up right where you left off.
Getting Started:
The first recommendation we have is to rename your project. You can do this by selecting the “New Project” default title towards the top left of your screen.
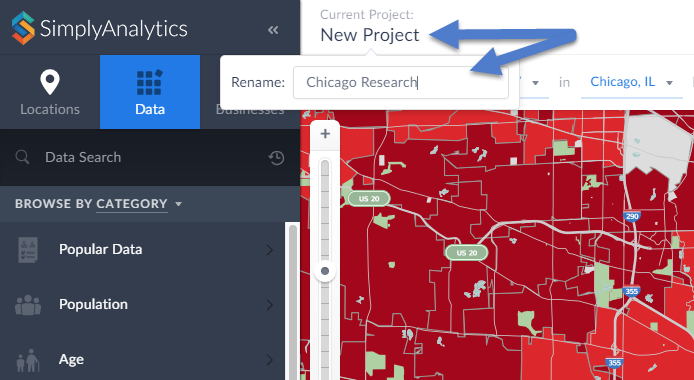
Enter a new name within the available text field and hit Enter to save your current project.
Managing Your Project:
Select Manage Project from the top-right of your screen. From here you will have some editing options available:
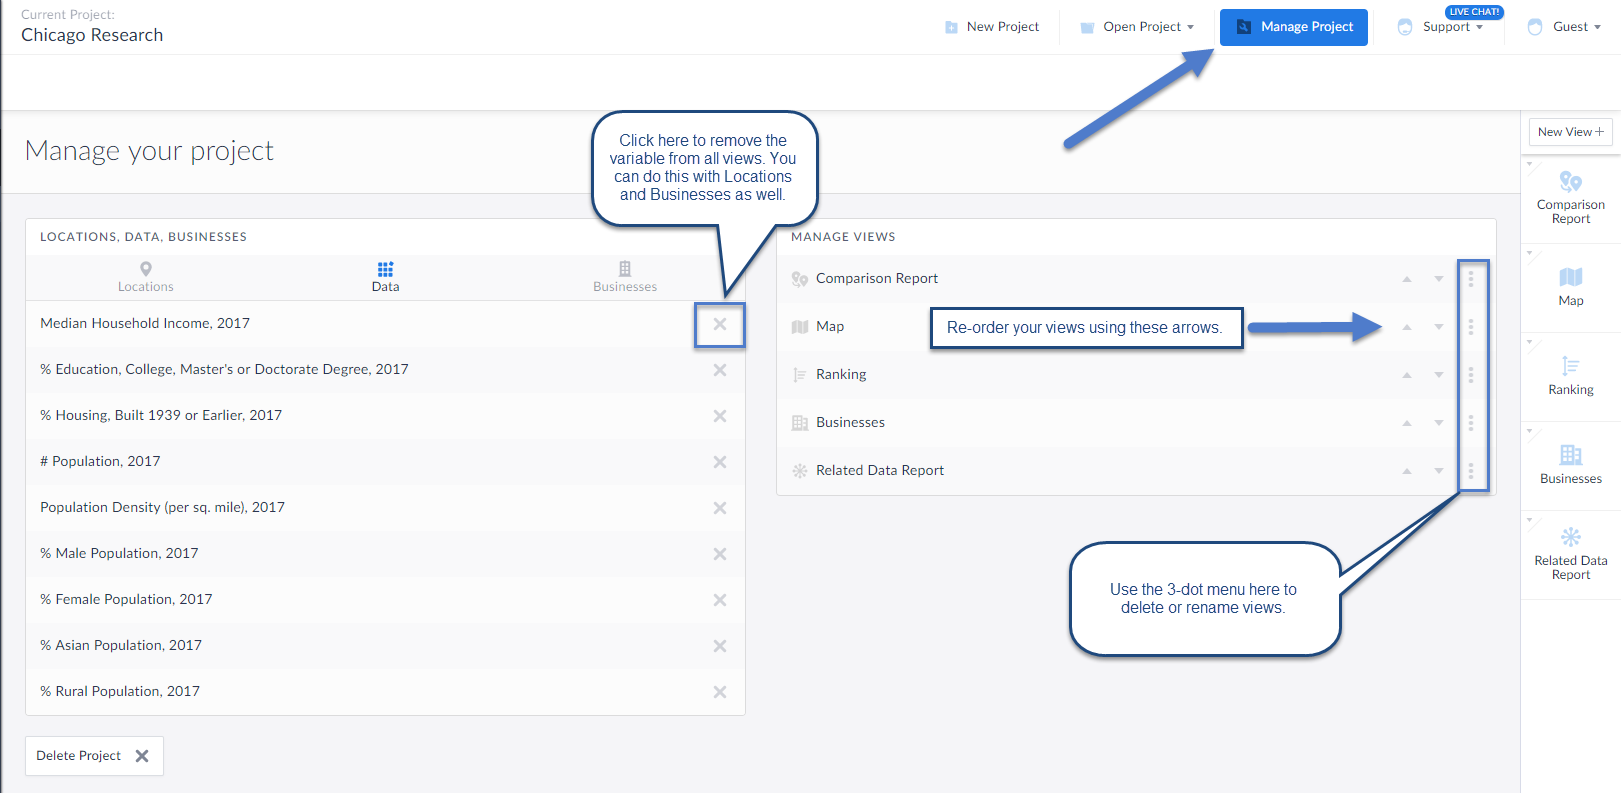
You can choose to remove any locations, data variables or searches within your project using the options available towards the left of your workspace. This will remove those items from all views they reside in along with removing them from the Edit View screen.
Manage Views: The three-dot menu within this area will allow you to delete or rename the view. Additionally, the up and down arrows will allow you to arrange your views in order of how they appear on the right-hand side of the interface.
Creating a New Project: Select New Project to get started with a brand new project (no locations, variables, searches).
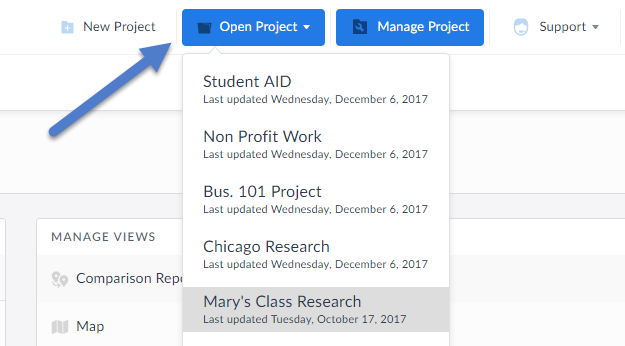
You can always select Open Project to toggle back to older projects.
That’s it for this week’s blog, stay tuned for more!
More from SimplyAnalytics
Posted on May 08, 2018 by Admin
We will be exhibiting at the SLA conference in Baltimore, MD this June. Stop by booth #912 and say hello - we look forward to demonstrating SimplyAnalytics, answering your questions, and ...
Posted on Jul 22, 2015 by Admin
In this week’s SimplyMap report, we take a look at one of our newly available data packages - ConneXions® from Nielsen. The ConneXions® segmentation system integrates consumer behavior an...
Posted on Jun 21, 2022 by Admin
Hello readers! We hope you’re having a great day. Today we are featuring 5 commonly asked questions about the American Community Survey dataset that’s available to all customers in Simply...
Posted on May 23, 2019 by Admin
Come visit the SimplyAnalytics team at the Special Library Association's Annual Conference in Cleveland. Special librarians and other information professionals come together at SLA’s annu...
Posted on Apr 27, 2015 by Admin
In this week’s write up we want to share some quick tips and tricks that you might not yet know about in SimplyMap. TIP #1 Did you know that you can share your work? SimplyMap allows you ...
Posted on Jun 09, 2021 by Admin
Hello readers! SimplyAnalytics will be exhibiting at the Virtual ALA Annual Conference this year on June 23-26. Be sure to drop by our booth, and click the banner image to video chat with...
Posted on Jun 07, 2011 by Admin
We will be exhibiting at the Special Library Association Annual Conference in Philadelphia and the American Library Association conference in New Orleans later this month. Come and visit ...
Posted on Apr 14, 2016 by Admin
This week’s SimplyMap report will provide an overview of one of the more advanced functionalities in SimplyMap - applying multiple filter conditions. Filters can be applied to any map or ...
Posted on Jun 25, 2015 by Admin
In this week’s SimplyMap report, we review the different options available when searching for a business. The easiest and fastest method of mapping businesses or creating a business repor...
Posted on Nov 28, 2012 by Admin
Come visit the SimplyMap team at the ALA Midwinter Meeting, January 25 - 28, 2013 in Seattle, WA. We will be in Booth 1307, and as always we look forward to meeting with customers new and...