


Exploring SimplyMap Data: Sales At Gift and Souvenir Shops
Posted on Aug 26, 2015 by Admin
Most people in the United States could probably guess which cities are popular amongst tourists - Los Angeles and New York. But can you guess how much money is spent in novelty and souvenir shops at these popular destinations? In this quick SimplyMap report, we will use data from the Retail Market Power data package to find the answers to that. The figures might surprise you! Let’s get started.
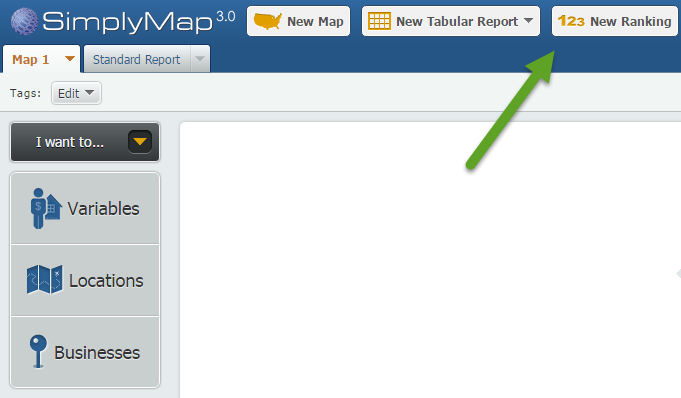
First, create a new Ranking Report.
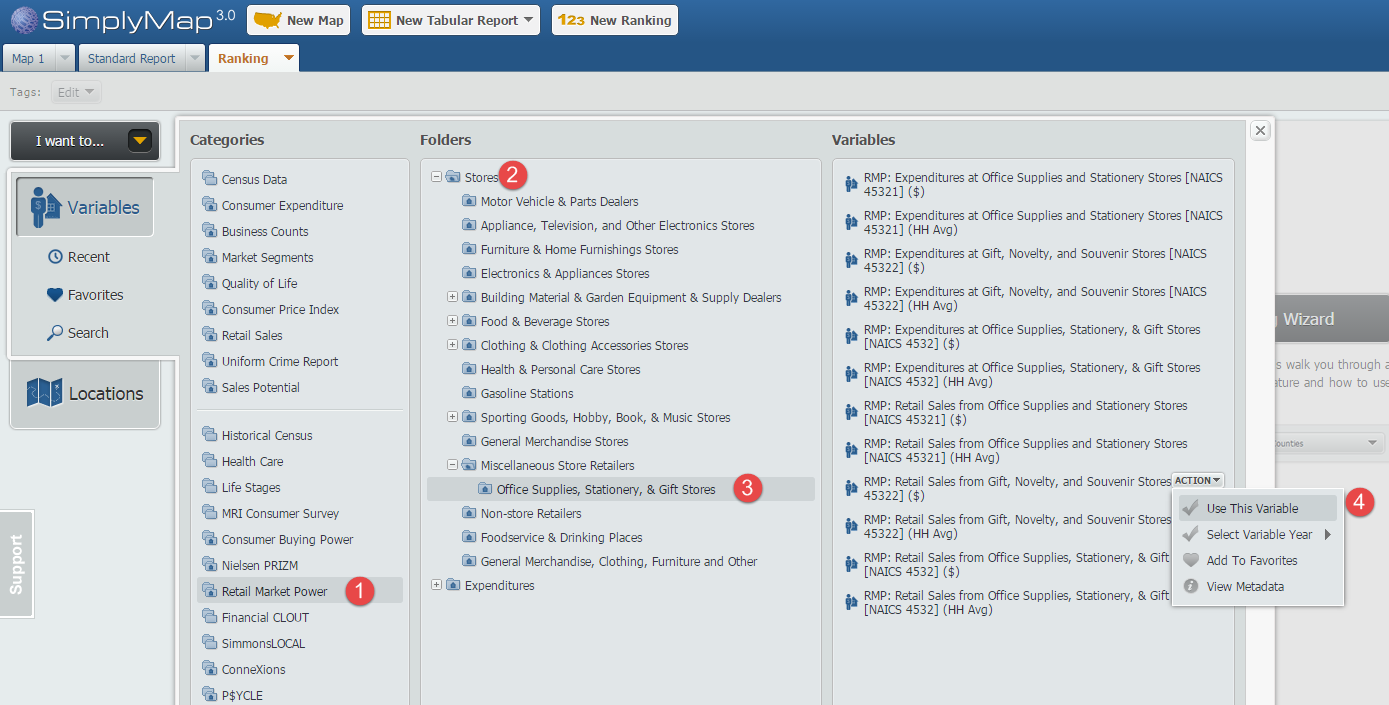
Next, navigate through this path: Retail Market Power » Stores » Miscellaneous Store Retailers » Office Supplies, Stationery, & Gift Stores.
Use the variable titled, RMP: Retail Sales from Gift, Novelty, and Souvenir Stores [NAICS 45322] ($), 2014. Image below for reference.
Next, click on the Locations panel and select USA as your geography. For reference, the USA at large has a grand total of $34,981,081,171.00 in yearly sales at Gift, Novelty and Souvenir stores.
Lastly, select Cities from the Analyze Data By dropdown menu. (Note: we also applied a data filter for population > 150k. You can read more about filters here).
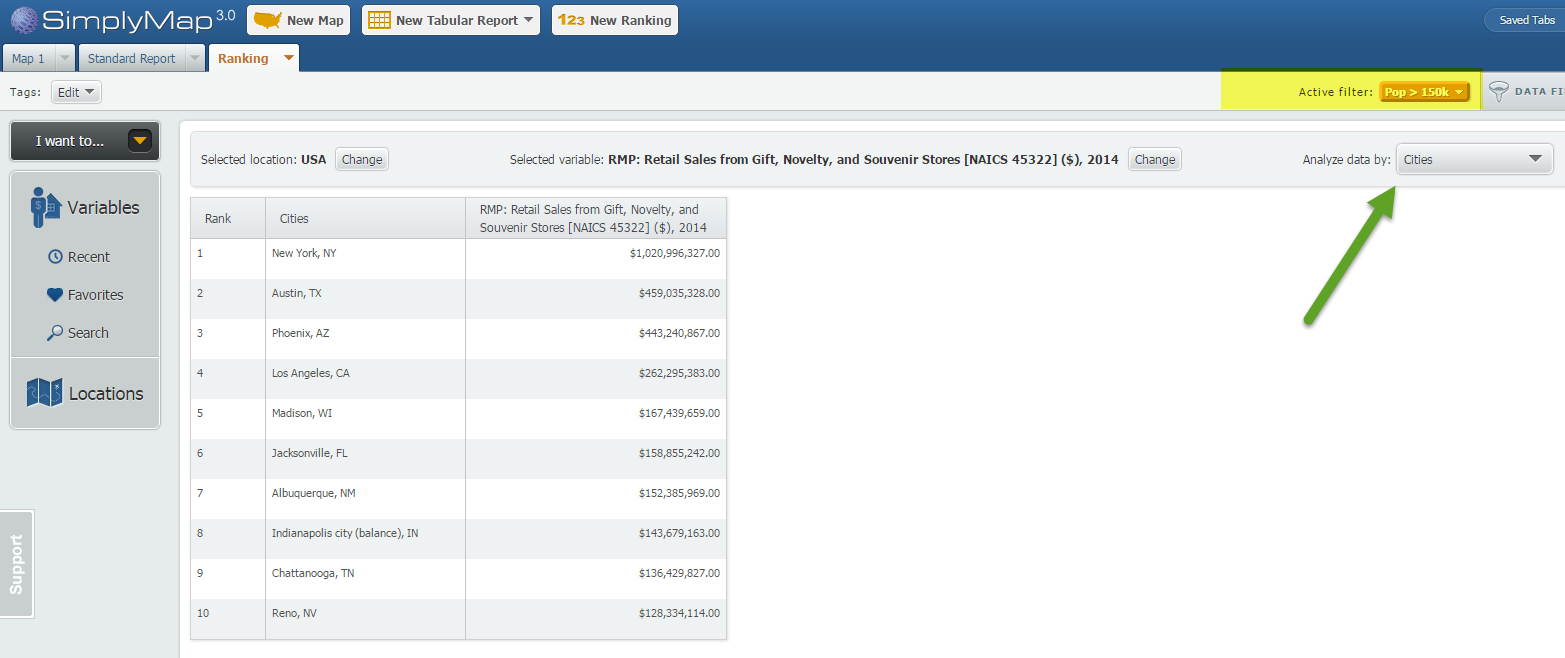
Not surprising, New York takes the #1 spot here with a total of $1,020,996,327.00. The number itself was initially surprising - keep in mind that is only sales at gift/novelty and souvenir stores! A quick google search shows that NYC was visited by over 54 million tourists in 2013 - so perhaps the one billion dollar total in souvenir/gift shop sales is not so surprising after all!
A distant second is Austin, TX with $459,035,328.00. Rounding out the top 5:
3. Phoenix, AZ - $443,240,867.00
4. Los Angeles, CA - $262,295,383.00
5. Madison, WI - $167,439,659.00
We hope you enjoyed this week’s SimplyMap report. Let us know if there is a particular data set or variables you are interested in reading more about. We’d be happy to feature them in our weekly blog.
More from SimplyAnalytics
Posted on May 17, 2012 by Admin
We will be exhibiting at the American Library Association (ALA) Conference in Anaheim Friday June 22nd - Monday June 25th. Visit us at Booth 421 to learn more about SimplyMap and enter ou...
Posted on Feb 05, 2015 by Admin
In this week’s edition of exploring SimplyMap data, we take a look at America’s coffee drinkers. SimplyMap contains more than 100 coffee related variables, including consumer spending on ...
Posted on Mar 21, 2018 by Admin
The Quick Report is one of the newest features added to SimplyAnalytics - let’s take a look at how it can support your research. This report instantly provides you with a curated list of ...
Posted on Nov 10, 2017 by Admin
Welcome to this week’s SimplyAnalytics blog post. Today we’re going to take a closer look at the options available to you when editing the map legend. Let’s get started! First, to start e...
Posted on Dec 06, 2009 by Admin
ALA's Choice Magazine, publisher of independent reviews of products and services for academic libraries, released a new review of SimplyMap in the December 2009 edition. The reviewer, Car...
Posted on Jun 02, 2017 by Admin
We can't wait for ALA Annual this Summer, and the opportunity to share SimplyAnalytics with the ALA community. Stop by the SimplyAnalytics booth (1339) and take a peak at what we've been ...
Posted on Sep 05, 2019 by Admin
SimplyAnalytics will be exhibiting at the biennial North Carolina Library Association conference, to be held this year at the Winston-Salem Benton Convention Center. If you are attending,...
Posted on Apr 18, 2017 by Admin
We look forward to attending the Texas Library Association Conference this week in San Antonio and visiting with the library community. Stop by our new SimplyAnalytics booth (2029) and ta...
Posted on Oct 07, 2013 by Admin
Do you know the quickest way to find the name of a Block Group, Census Tract or ZIP code in our upcoming release for 3.0? The i-Tool gives you the ability to click anywhere on a map to g...
Posted on Aug 30, 2009 by Admin
Jeff Zaslow, Wall Street Journal columnist and co-author of the The Last Lecture, will speak at the Orlando, FL Public Library on Friday, September 11 at 7 p.m. Zaslow helped the late Ran...