


Release Announcement
Posted on Nov 28, 2023 by Admin
Hello readers! We are happy to announce that SimplyAnalytics has successfully migrated to the Census 2020 boundaries on Sunday, November 19th. This blog will talk about what that is, what it means for you now, and what it means moving forward. Let’s get into it.
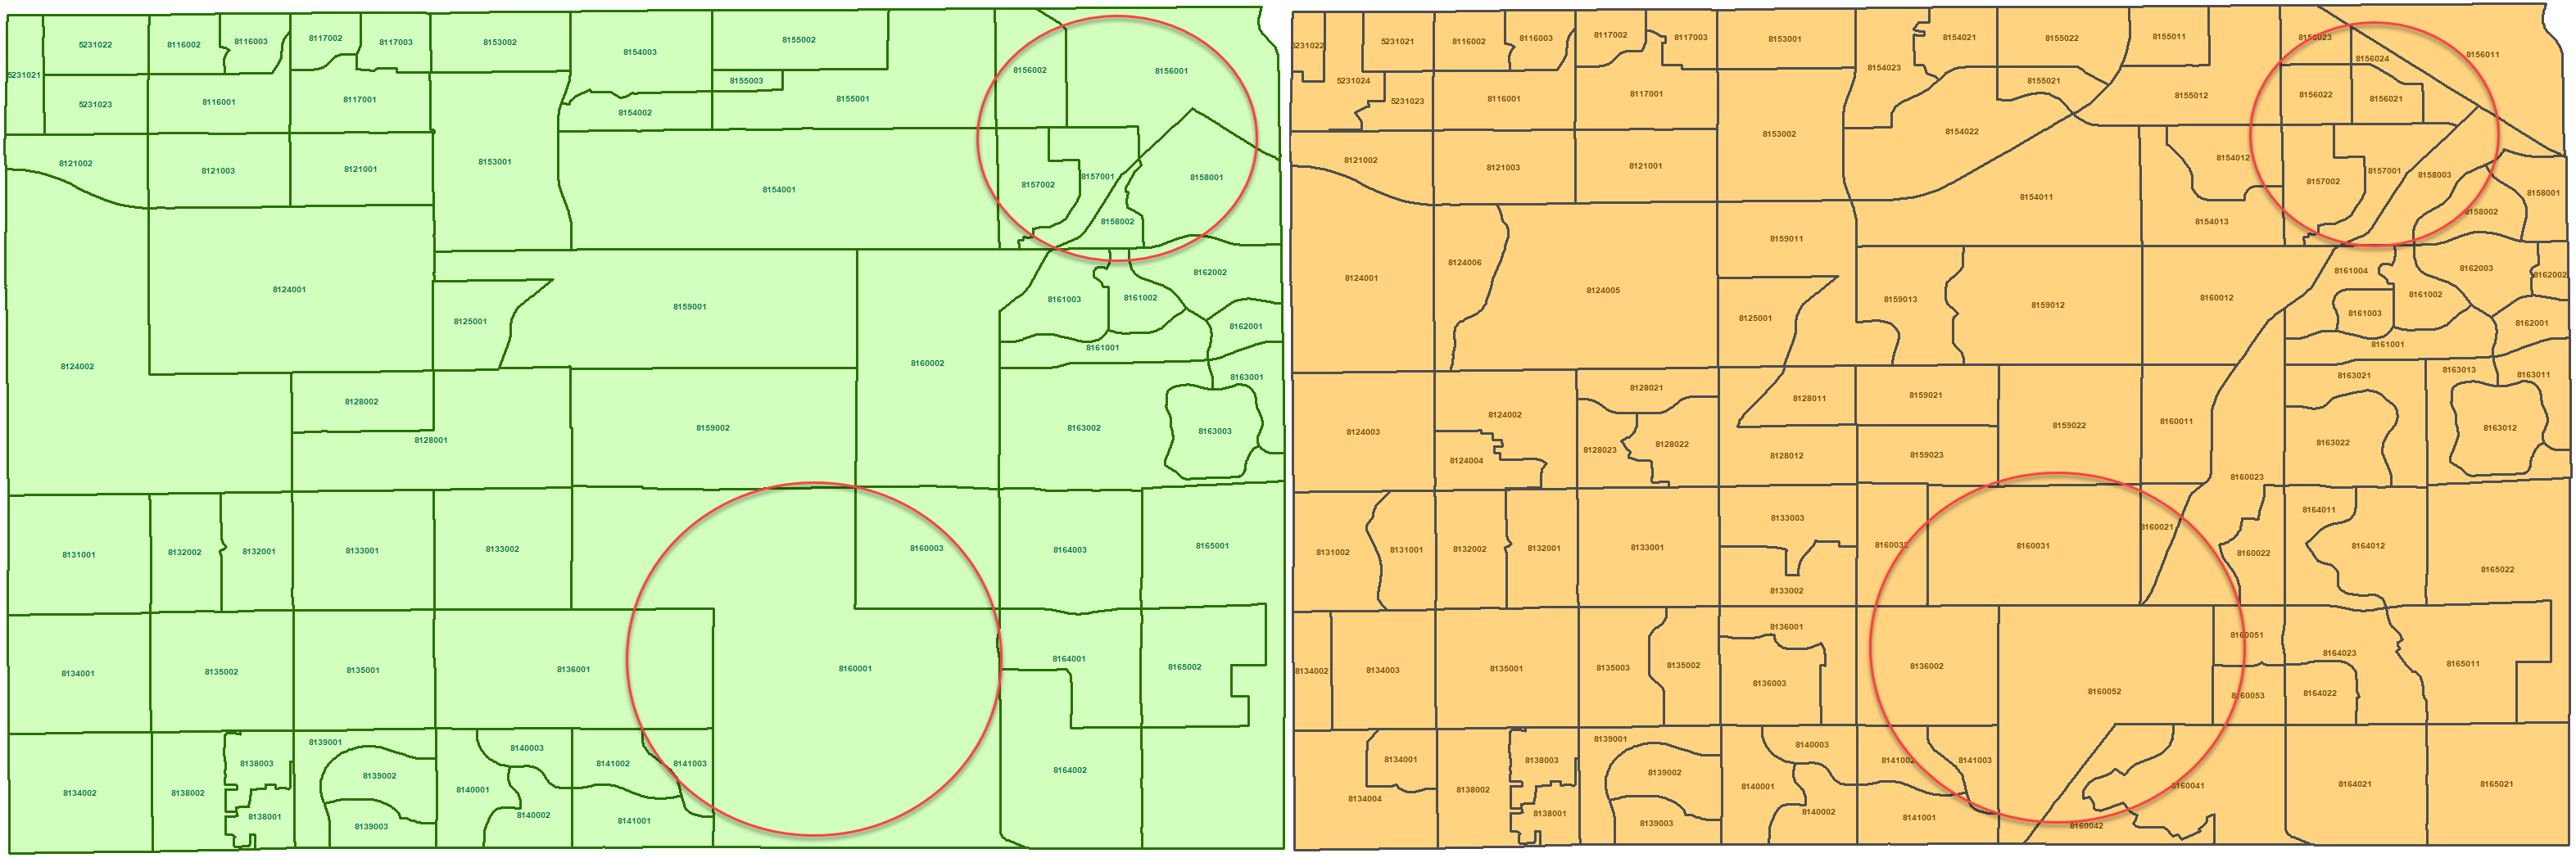
What is this migration all about?The United States Census Bureau provides updates to location boundaries every 10 years. They do this based on population changes and to ensure fair representation for locations that have changed over time. For example, maybe a Census Tract or Census Block Group has grown in population over time, and once it reaches a certain population threshold, that Census Tract or Block Group will get split up, and new Tracts or Block Groups will be created.
Check out the example below that highlights the same area in Arizona in 2019 (green), and then with updated boundaries in 2020 (orange).
If you’re interested in a more detailed overview of this, feel free to check out the video here: https://vimeo.com/user68002385/simplyanalytics-historical-mode?share=copy
What does it mean for SimplyAnalytics?By default, SimplyAnalytics is now in 2020 boundaries, and with that comes a host of newer data, including 2023 Community Demographics, the complete 2021 ACS (with 2022/23 estimates), The 2020 Decennial Census, and a new 2020 Election dataset - more on that in a future blog.
For returning users: If you are a returning user, you might notice that your views have a historical badge on them or that there’s a note at the top, and it’ll look like this:
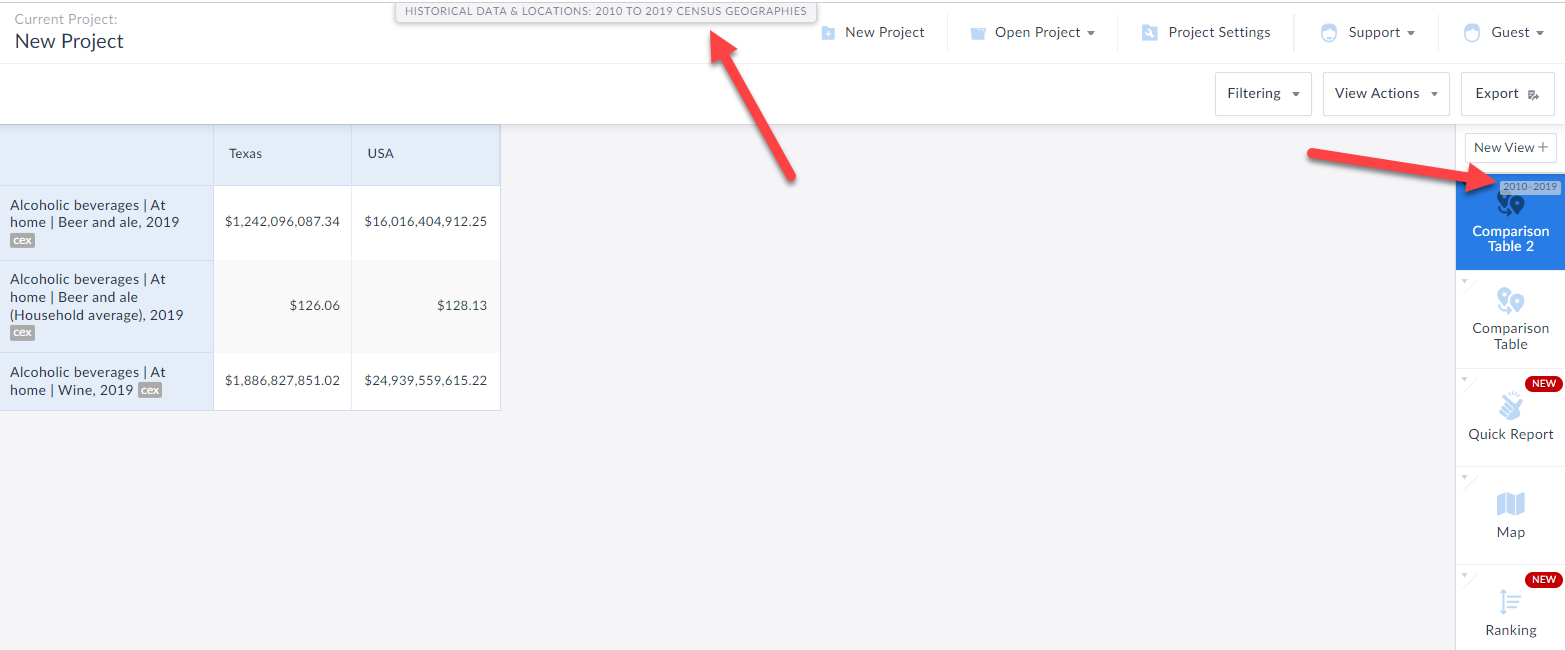
This is because all of your work prior to Nov. 19th, 2023, would have been in the older geographies, but as mentioned above SimplyAnalytics now defaults to 2020 Census boundaries.
What if I want to explore the newest data? If you want to use the newest data, simply click on New View at the top-right of the screen and proceed as you normally would. However, if you want to continue using the now older data, you’ll have to go into historical mode - similarly, some datasets are not yet migrated to the new boundaries, and so if you want to access those, you’ll need to use historical mode.
Final NotesFor existing/returning users, we understand that there might be some confusion with accessing some datasets that are not yet available in the newer geographies. But please note that this is temporary. As all future years of the datasets you’ve come to love come online, the only reason you’ll need to go into Historical Mode will be if you want older years of data which is how it has traditionally been.
As always, we are here to help! Please email support@simplyanalytics.com if you are running into any issues.
More from SimplyAnalytics
Posted on Jan 29, 2016 by Admin
In a previous blog entry, we highlighted the benefits of having multiple years of data available for the same variable. This allows users to identify trends over time. Keeping with the sa...
Posted on Dec 09, 2014 by Admin
In this week’s SimplyMap blog post, we set out to discover which large US cities spend the most money per year on their pets. To find this out we used the variable, “Pets, Household Avera...
Posted on Feb 23, 2012 by Admin
Geographic Research, Inc. will be exhibiting at the Public Library Association (PLA) Conference. Visit us at Booth 2329 to learn more about SimplyMap and enter our raffle for a new com...
Posted on Jul 28, 2013 by Admin
We recently discovered some interesting data on participation and attitudes towards recycling, and decided to dig a bit deeper into our Experian SimmonsLOCAL data. This data package inclu...
Posted on May 08, 2018 by Admin
We will be exhibiting at the SLA conference in Baltimore, MD this June. Stop by booth #912 and say hello - we look forward to demonstrating SimplyAnalytics, answering your questions, and ...
Posted on Jun 08, 2023 by Admin
We are excited to announce Mansi Nishit Trivedi as the winner of the 2023 BRASS Student Travel Award sponsored by SimplyAnalytics! Mansi, a Master of Information student at Dalhousie, has...
Posted on Jan 08, 2018 by Admin
The SimplyAnalytics team will be exhibiting at ALA Midwinter in Denver February 9-12. Stop by booth 2152 for a visit and a tour of SimplyAnalytics, the best-in-class analytics and data vi...
Posted on May 28, 2009 by Admin
The Charleston Advisor, which publishes critical reviews of online resources for libraries, published a review of SimplyMap in April. We are very pleased to have received 4 1/4 stars out...
Posted on Jan 28, 2010 by Admin
Come visit the Geographic Research booth at the Ontario Library Association Super Conference, February 24-27, 2010 at the Metro Toronto Convention Centre. The Ontario Library Association ...
Posted on May 02, 2016 by Admin
Inspired by a recent support desk question, this week’s SimplyMap report will demonstrate how a user would run a business search that consists of multiple names. In short, the user was at...