


SimplyMap Tip – Creating a Map from a Ranking Report
Posted on Nov 17, 2014 by Admin
Our recent series Exploring SimplyMap Data Reports has focused on creating ranking reports for unique variables. Accordingly, we thought it would be helpful to write a quick tip on how to create a map directly from the ranking results.
After creating a ranking report in SimplyMap, you can quickly create a map using any of the locations in your ranking. Let’s look at an example.
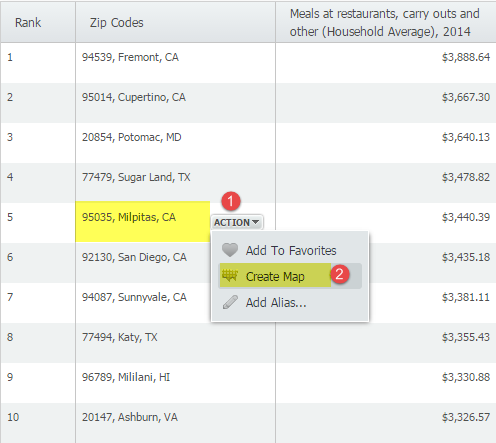
Our November 6 Report, “Which US Locations Dine Out the Most?” identified ZIP code 95035 in Milpitas, CA as the ZIP Code with the highest average spending on restaurant and carry out meals. We can find out exactly where it is located by mapping the location directly from the report by hovering over the location and selecting “Create Map” from the action dropdown, as shown below:
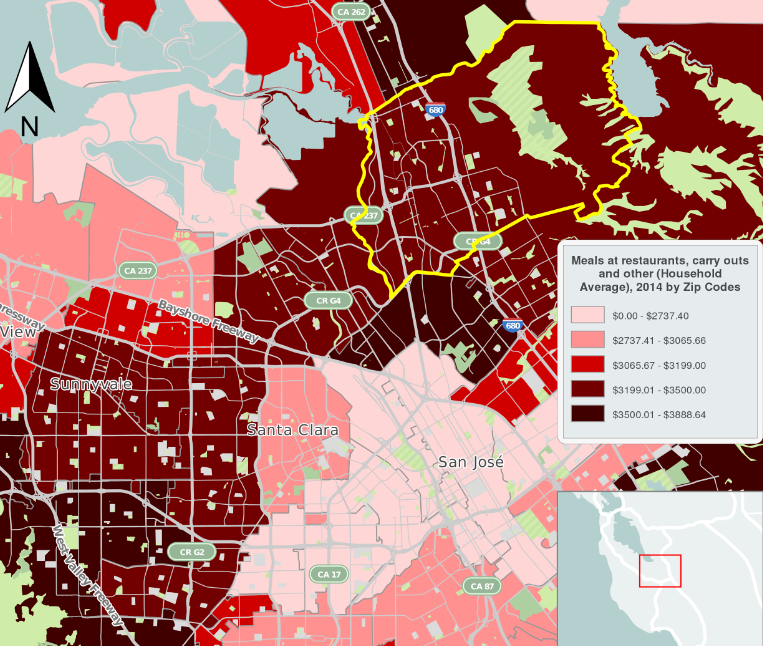
A map using the ranked variable (Meals at restaurants, carry outs and other (Household Average), 2014) will then be created. The image below shows an exported image of ZIP code 95035 in Milpitas, CA.
Stay tuned for more SimplyMap tips and tricks!
More from SimplyAnalytics
Posted on May 25, 2010 by Admin
The American Library Association 2010 Annual Conference is coming and the GRI team is gearing up for another great event this summer. We will be in Washington, D.C. again this year, June ...
Posted on Jan 15, 2013 by Admin
The GRI team is looking forward to exhibiting at ACRL 2013 at the Indiana Convention Center in Indianapolis April 10 - 12, 2013. Every other year, ACRL offers its premier professional dev...
Posted on Apr 18, 2008 by Admin
A team of librarians at Drexel University has developed a detailed poster to introduce SimplyMap as a new research tool for the student body. The poster was launched on Drexel Research Da...
Posted on Sep 15, 2025 by Admin
SimplyAnalytics will be attending the upcoming NCLA Conference in Winston-Salem October 14-17!
Posted on Jun 08, 2023 by Admin
We are excited to announce Mansi Nishit Trivedi as the winner of the 2023 BRASS Student Travel Award sponsored by SimplyAnalytics! Mansi, a Master of Information student at Dalhousie, has...
Posted on Dec 30, 2009 by Admin
Skokie Public Library, in Skokie, IL has published a useful overview of SimplyMap on the Mike's Space blog on SkokieNet. The article is filled with examples of research questions that can...
Posted on Feb 02, 2024 by Admin
We are excited to be back exhibiting at PLA this April in Columbus, OH. Join us at Booth #2631 to discover how SimplyAnalytics can help libraries understand their service area, assist sma...
Posted on May 23, 2012 by Admin
We will be exhibiting at the Special Libraries Association (SLA) annual conference and Info-Expo at McCormick Place in Chicago Sunday June 15th - Tuesday July 17th. Visit us at Booth 124 ...
Posted on Oct 02, 2015 by Admin
In this week’s SimplyMap tip, we wanted to do a quick write up reminding users about the Saved Tabs feature within SimplyMap. Did you know that SimplyMap will automatically save all of yo...
Posted on Apr 30, 2008 by Admin
Doreen Harwood, Business Librarian from the University of Washington has developed a series of detailed tutorials on using SimplyMap. The tutorials, which are Flash-based and interactive,...