


Thanksgiving Data - Macy’s Parade
Posted on Dec 03, 2015 by Admin
With the Thanksgiving holiday last week, we decided to take a quick look into SimplyMap to see what pertinent variables are available for analysis.
First, open the Variables panel and click on Search. Type in “Thanksgiving” in the available box.
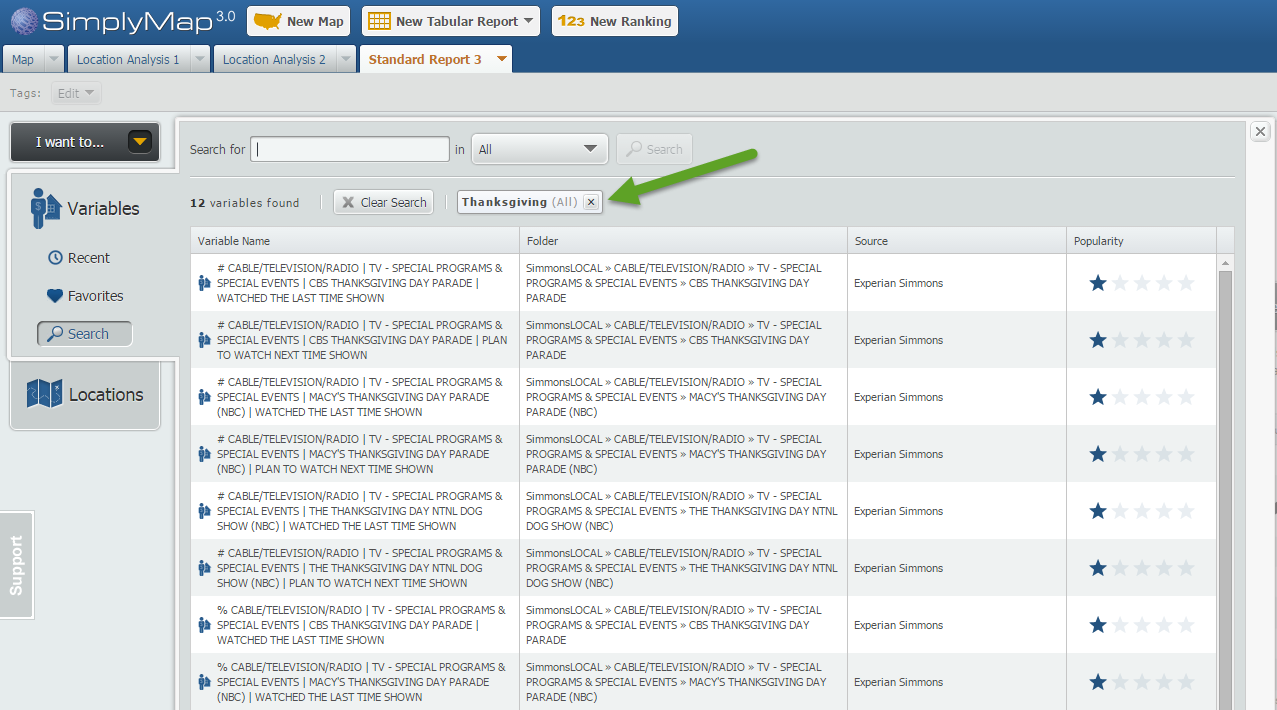
The results display a total of 12 variables related to the keyword ‘Thanksgiving’.For fun, we also searched the keyword: turkey. Care to take a guess how many turkey related variables are in SimplyMap?
If you guessed 122, you’re right! There is a grand total of 122 variables related to the word ‘turkey’, ranging from:
% Households Traveling - Foreign Travel (Including Alaska & Hawaii): Countries or destinations visited: Turkey, 2014
to variables such as:
% Households Using - Chicken & Turkey Fresh Or Frozen: Used in last 6 months, 2014
Interesting! Now returning to our original Thanksgiving search we decided to find out the estimated expected number of viewers for this year’s Macy’s Thanksgiving Parade.
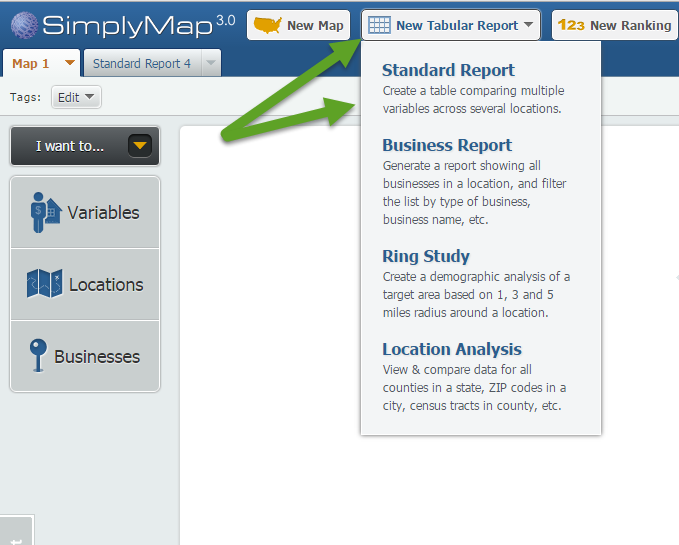
Click on New Tabular Report > Standard Report
The Thanksgiving variables are located in the SimmonsLOCAL folder. The SimmonsLOCAL data set is a premium add on module available for trial or purchase and includes over 60,000 data variables.
Navigate through this path: SimmonsLOCAL » CABLE/TELEVISION/RADIO » TV - SPECIAL PROGRAMS & SPECIAL EVENTS » MACY'S THANKSGIVING DAY PARADE (NBC)
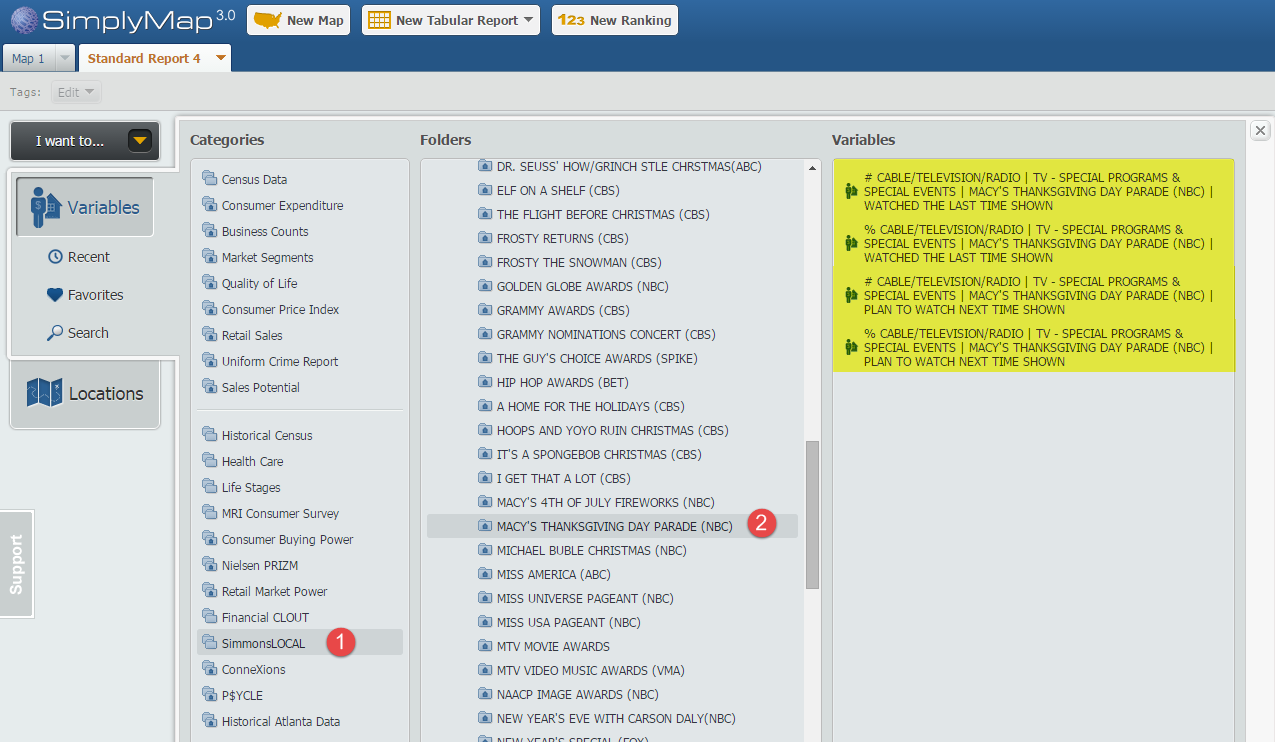
Choose the four variables within the folder, and close out the Variables panel to generate your report for the United States.
Results:
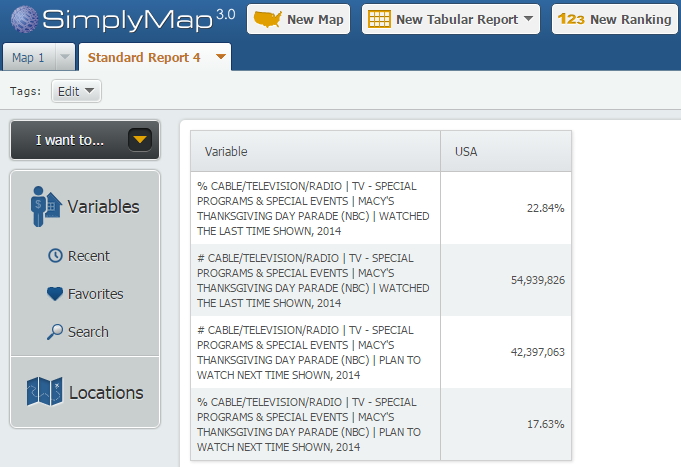
It’s estimated that over 54,000,000 people in the US responded that they had seen the Macy’s Thanksgiving Parade in 2014, with over 42,000,000 responding that they plan to watch the next event!
We hope you enjoyed this week’s report. Stay tuned for more SimplyMap tips and reports.
More from SimplyAnalytics
Posted on Jul 19, 2016 by Admin
Are you a tech wizard? Maybe you’re an apprentice? Learn more about technology consumption behaviors using the Simmons MOSAIC Technology Adoption segments located within the SimmonsLOCAL ...
Posted on Nov 28, 2023 by Admin
Hello readers! We are happy to announce that SimplyAnalytics has successfully migrated to the Census 2020 boundaries on Sunday, November 19th. This blog will talk about what that is, what...
Posted on May 28, 2009 by Admin
The Charleston Advisor, which publishes critical reviews of online resources for libraries, published a review of SimplyMap in April. We are very pleased to have received 4 1/4 stars out...
Posted on Sep 10, 2010 by Admin
SimplyMap Canada is now available at several Canadian institutions, including York University and Ryerson University, in Toronto. SimplyMap Canada has all of the great features included i...
Posted on Nov 22, 2016 by Admin
We will be exhibiting at ALA Midwinter in Atlanta, Georgia in January. You can find the GRI team at Booth 1155, where we will be catching up with customers old and new, and sharing some e...
Posted on May 08, 2018 by Admin
This summer's ALA conference is in New Orleans and the SimplyAnalytics team will be exhibiting at booth #837. We hope you stop by to learn about new features, check out our new data offer...
Posted on Aug 22, 2009 by Admin
Lynda Kellam, the Data Services & Government Information Librarian at the University of North Carolina, Greensboro has produced some new tutorial videos to help students learn how to ...
Posted on May 19, 2016 by Admin
Drop by booth #215 at the SLA 2016 conference to chat with us and get the latest info on SimplyMap. We look forward to seeing our customers, friends, and all others interested in learning...
Posted on Jun 01, 2014 by Admin
Visit the SimplyMap team at the ALA Annual Conference and Exposition in Las Vegas later this month. We will be at booth 1271, offering product demonstrations, tips & tricks, and of co...