


Exploring SimplyMap Data: Internet Search Engines
Posted on May 26, 2016 by Admin
In this week’s report exploring SimplyMap data, we take a look at the variables available relative to internet search engines used. The source of this data will come from the SimmonsLOCAL data set which, as we’ve mentioned before, contains over 60,000 data variables. With that much data available, it’s safe to say that this series will be around for a very long time. Let’s get started!
Our general assumption here is that Google is the most used search engine in the United States. But does the data backup our assumption? Let’s find out.
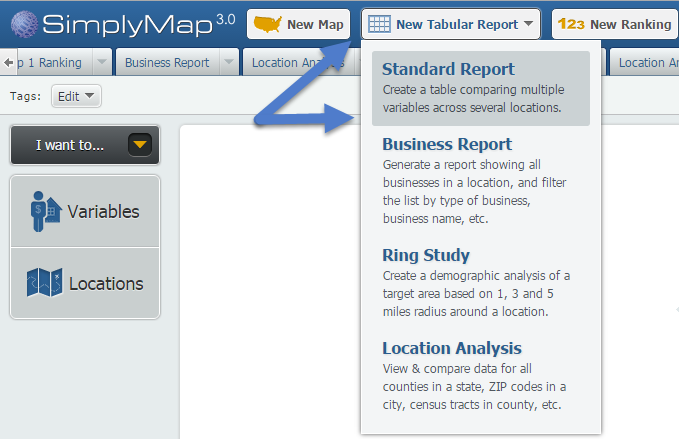
First, create a new Standard Report under the New Tabular Report button:
Next, open the Variables panel and navigate through the following path to find the variables of interest: SimmonsLOCAL » INTERNET » SEARCH ENGINES(COMPUTERS & OTHR DEVICES) » SEARCH ENGINES - HOW USED » SEARCH ENGINE I CURRENTLY USE MOST OFTEN.
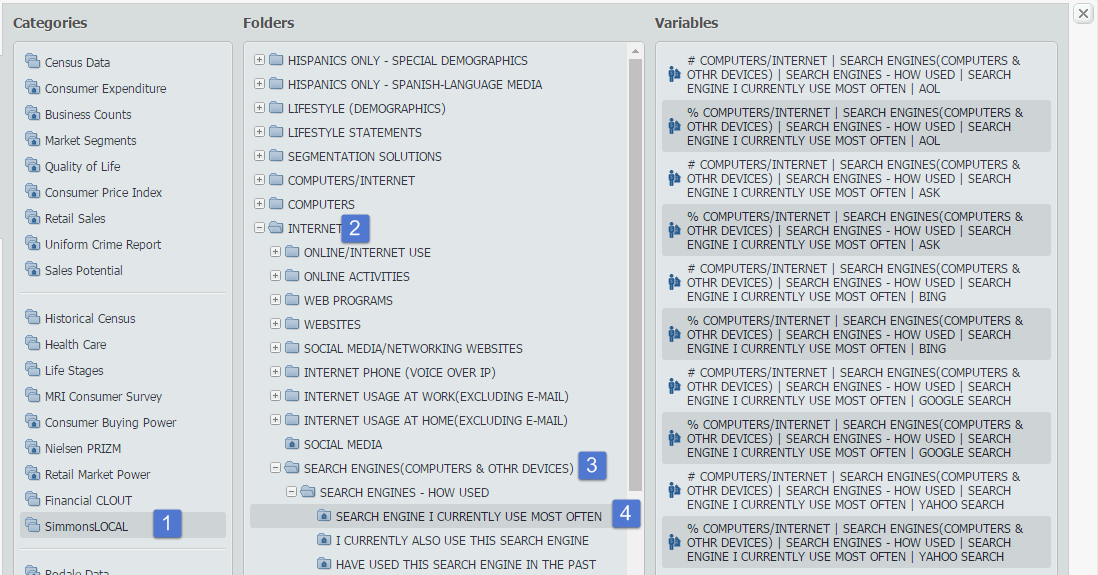
In total, there are four folders that contain search engine data, broken down by:
1. Search Engine I Currently Use Most Often
2. I Currently Also Use This Search Engine
3. Have Used This Search Engine in the Past
4. I Have Never Used this Search Engine
Each folder contains data on five search engines:
1. AOL
2. Ask
3. Bing
4. Google
5. Yahoo
As the path above indicates, we’ll be focusing on the first folder - Search Engine I Currently Use Most Often. Once you have selected the associated percent variables for the 5 search engines, close out your report to compile the data for the United States. Results below!
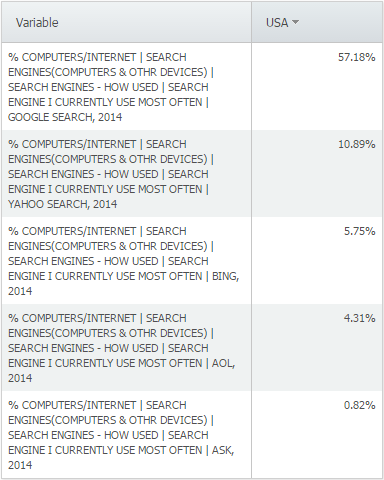
Our assumption was proven correct by the data, although the disparity between the search engines was surprising, with Google being the overwhelming favorite here in the United States.
Last week we posted a map challenging readers to guess what the map was portraying. The correct answer? Average Annual Snowfall (Total Inches)! If you guessed correctly, good job. If not, stay tuned for more!
More from SimplyAnalytics
Posted on Feb 23, 2012 by Admin
Geographic Research, Inc. will be exhibiting at the Public Library Association (PLA) Conference. Visit us at Booth 2329 to learn more about SimplyMap and enter our raffle for a new com...
Posted on Aug 20, 2015 by Admin
Is there a specific age group and income bracket you are specifically interested in researching for a target location? Our Life Stages module has the information you need. Life Stages, by...
Posted on Feb 27, 2015 by Admin
SimplyMap is an excellent tool for market research, and it’s made even more powerful by Nielsen PRIZM data. Nielsen PRIZM is the highest quality market segment data available. Every house...
Posted on May 25, 2010 by Admin
We will be exhibiting at the 2010 SLA Annual Conference & INFO-EXPO June 13-15 at the Ernest N. Morial Convention Center in New Orleans, LA. Join us at booth 1537 - bring your quest...
Posted on Jul 30, 2018 by Admin
Hello readers! Welcome to this week’s blog. This week we will feature the Related Data Table view and how you can use it to maximize your productivity in SimplyAnalytics. What is it? The ...
Posted on May 18, 2015 by Admin
The SimplyMap team is looking forward to visiting with customers and others at the SLA Annual Conference, coming to Boston on June 14-16. Come visit us at Booth #916, we are happy to answ...
Posted on Sep 28, 2018 by Admin
Welcome readers! Today we have a quick feature highlight that will assist you in browsing and searching for data variables. All data variables have a path where they reside within their d...
Posted on Dec 08, 2010 by Admin
The GRI team will be attending the American Library Association Midwinter meeting this year at the San Diego Convention Center. Visit us in booth 1055 in the exhibit hall from January 7 -...
Posted on Dec 03, 2012 by Admin
Come visit the Geographic Research booth at the Ontario Library Association Super Conference this season. The conference will take place on January 30 - February 2, 2013 at the Metro Toro...
Posted on Nov 24, 2014 by Admin
In this week’s report, we research America’s most educated cities. SimplyMap contains a total of 111 educational attainment variables, including general population and by race. We used th...