


Exploring SimplyMap Data - Median Rent
Posted on Jan 29, 2016 by Admin
In a previous blog entry, we highlighted the benefits of having multiple years of data available for the same variable. This allows users to identify trends over time. Keeping with the same theme, this week we’ll take a look at how the median rent has changed between 2000, 2010 and 2015.
Let’s take a quick look at the US and move on to some cities we suspect may show a marked increase.
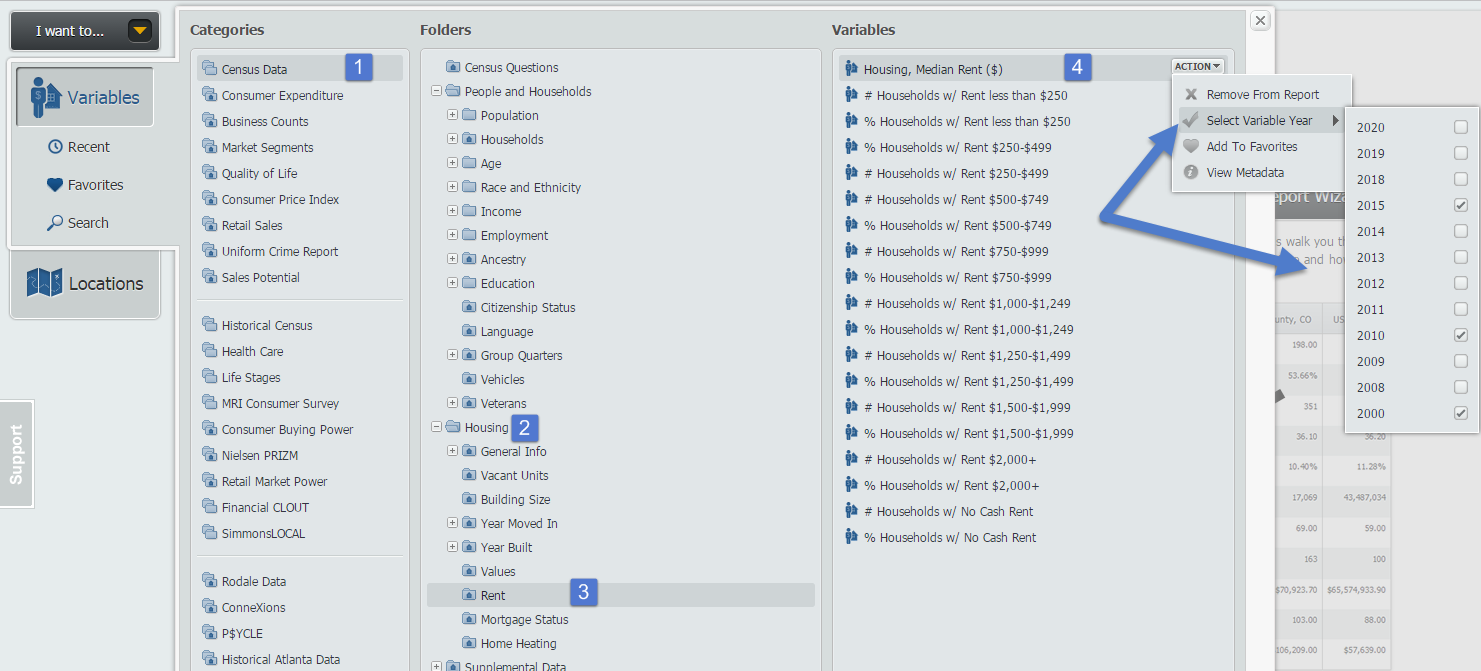
First, create a Standard Report and navigate through the median rent variable at this path: Census Data » Housing » Rent.
Next, hover over the variable and use the Select Variable Year option to select the years 2000, 2010 and 2015. Picture below for reference.
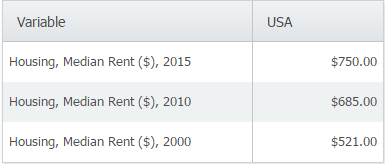
Close out the variables panel, and the report will generate:
To see how some other cities compare in their changes over time, return to the Locations menu to add your new locations. Here’s a report showing the median rents over time for: San Francisco, New York, Seattle, Chicago, Denver and San Antonio.
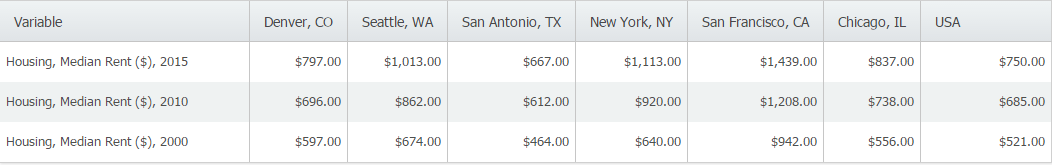
Key Takeaways from the Data:
- San Francisco’s median rent is almost double the median for the United States.
- San Antonio’s median rent is well below many other comparatively large markets.
We hope you enjoyed this week’s SimplyMap report. Stay tuned for more!
More from SimplyAnalytics
Posted on Nov 10, 2017 by Admin
Welcome to this week’s SimplyAnalytics blog post. Today we’re going to take a closer look at the options available to you when editing the map legend. Let’s get started! First, to start e...
Posted on May 06, 2013 by Admin
We will be exhibiting at ALA 2013 at McCormick Place in Chicago, IL, June 28-July 1. The ALA Annual Conference programs, updates, conversations, and other events cover all of the key issu...
Posted on Mar 13, 2023 by Admin
Hello readers! Today, we’re excited to officially introduce the Location Query Report in SimplyAnalytics. The Location Query Report is a powerful feature in SimplyAnalytics that allows us...
Posted on Nov 23, 2012 by Admin
Men's Health magazine is charting vanity in US cities, with help from SimplyMap. What did they find? The Sunshine State, with a long history of going to great lengths to look good, tops t...
Posted on Jun 11, 2026 by Admin
SimplyAnalytics is excited to exhibit at ALA Annual 2026 in Chicago! Visit us at Booth #4336 to meet our team, ask questions, and learn more about the latest SimplyAnalytics features and ...
Posted on Apr 27, 2015 by Admin
In this week’s write up we want to share some quick tips and tricks that you might not yet know about in SimplyMap. TIP #1 Did you know that you can share your work? SimplyMap allows you ...
Posted on Oct 08, 2008 by Admin
Geographic Research, Inc. (GRI) is pleased to sponsor the fourth annual American Collegiate Retailing Association’s Undergraduate Student Retail Analysis Competition. This is the second ...
Posted on Oct 30, 2018 by Admin
We are pleased to be exhibiting at this year's 30th Annual Charleston Library Conference! The Charleston Vendor Showcase will be held Tuesday, November 6, 2018, from 10:30 a.m. to 6:00 p....
Posted on Oct 02, 2015 by Admin
In this week’s SimplyMap tip, we wanted to do a quick write up reminding users about the Saved Tabs feature within SimplyMap. Did you know that SimplyMap will automatically save all of yo...
Posted on Feb 01, 2009 by Admin
Want to know the top 10 wealthiest ZIP codes in your state? How about the top 25 counties with the most elderly residents? Duke University students can now easily answer these questions a...