


Exploring SimplyMap Data: America’s Work from Home Employees
Posted on Feb 13, 2015 by Admin
In this week’s report exploring SimplyMap data, we want to find out where America’s remote workers reside. To find this, we can tap into the Census data in SimplyMap. The specific variable is titled: % Employment, Work at Home, 2014.
To get started ranking geographies, first select New Ranking at the top of the SimplyMap screen. Next, locate the variable by following this path: Census Data » In 2010 Geographies » People and Households » Employment » Travel to Work » Mode.
Lastly, to view this data by state select Locations, and set it to USA.
From the Analyze Data By dropdown, select “States” to rank the USA by all states. The results are shown below:
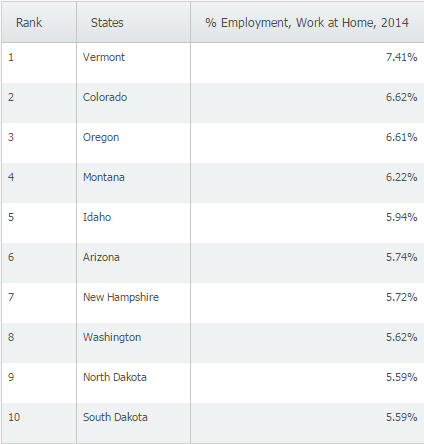
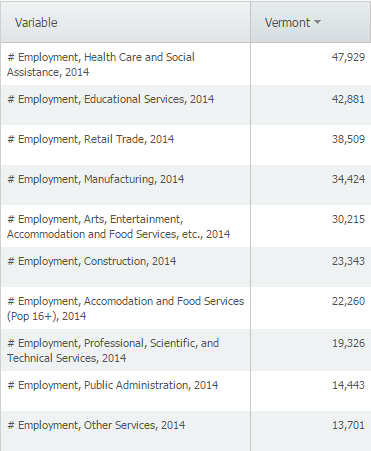
At 7.41%, Vermont ranks first in the US for remote workers. For reference, the national percentage is 4.38. Does anyone have insight as to why Vermont ranks first? A list of the most common employment industries in Vermont is below:
Lastly, we can look at the data by a different geography - change the Analyze Data By dropdown to display Cities. We can also apply a population filter to only show cities with a population greater than 100,000. Here are the results:
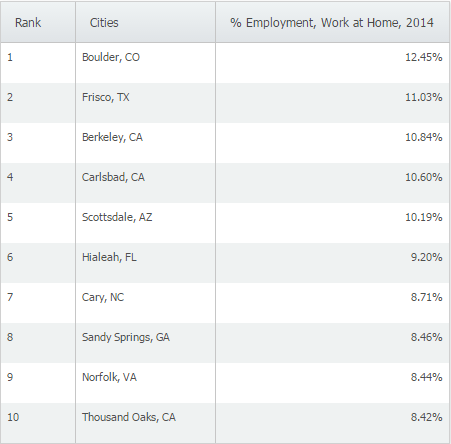
Boulder, CO ranks first in the United States for Work at Home employees. We think this could be attributed to the number of software and tech firms that have opened up or moved to that city in recent years.
We hope you found this SimplyMap report interesting. Stay tuned for more SimplyMap tips and interesting data reports.
Have you already entered for your chance to win an iPad or Kindle Fire? We will be holding the drawing on April 17, 2015. To enter, simply follow us on Twitter and Like Us on Facebook to get your name in consideration.
More from SimplyAnalytics
Posted on Apr 17, 2018 by Admin
The SimplyAnalytics team would like to congratulate Rachel Holder, MLS candidate at Indiana University for being selected as this year's recipient of the BRASS Student Travel Award! ...
Posted on Sep 27, 2019 by Admin
Hello readers! This week we provide an in-depth response to a question asking about the legend classification methods in SimplyAnalytics. This response is now part of our Help Center: htt...
Posted on Feb 17, 2015 by Admin
Our recent trip to Chicago exhibiting at the ALA Midwinter Meeting inspired this week’s SimplyMap blog post. Today, we’re going to demonstrate how to use business points in SimplyMap to a...
Posted on Jun 02, 2017 by Admin
We can't wait for ALA Annual this Summer, and the opportunity to share SimplyAnalytics with the ALA community. Stop by the SimplyAnalytics booth (1339) and take a peak at what we've been ...
Posted on Nov 28, 2023 by Admin
Hello readers! We are happy to announce that SimplyAnalytics has successfully migrated to the Census 2020 boundaries on Sunday, November 19th. This blog will talk about what that is, what...
Posted on Jun 21, 2019 by Admin
Come visit the SimplyAnalytics booth (#3010) at the upcoming ALA 2019 show in Washington, D.C.! Our team will be on hand offering quick demos of SimplyAnalytics, answering questions and s...
Posted on Feb 23, 2012 by Admin
Geographic Research, Inc. will be exhibiting at the Public Library Association (PLA) Conference. Visit us at Booth 2329 to learn more about SimplyMap and enter our raffle for a new com...
Posted on Jul 24, 2013 by Admin
Registration is now open for the North Carolina Library Association Conference! Visit us at the 60th biennial conference (Booth #45) through October 15 - 18, 2013. We have beautiful ca...
Posted on Nov 24, 2014 by Admin
In this week’s report, we research America’s most educated cities. SimplyMap contains a total of 111 educational attainment variables, including general population and by race. We used th...
Posted on Jul 28, 2013 by Admin
We recently discovered some interesting data on participation and attitudes towards recycling, and decided to dig a bit deeper into our Experian SimmonsLOCAL data. This data package inclu...