


Exploring SimplyMap Data: Frequent Flyer Programs
Posted on Sep 03, 2015 by Admin
This week we explore the SimmonsLOCAL data package to find which cities in America have the highest percentage of residents enrolled in a frequent flyer program. SimmonsLOCAL is available as an add on data package to SimplyMap, and contains over 50,000 variables. The data measures 210 American DMA's (Designated Market Areas) with data estimated down to the block group level.
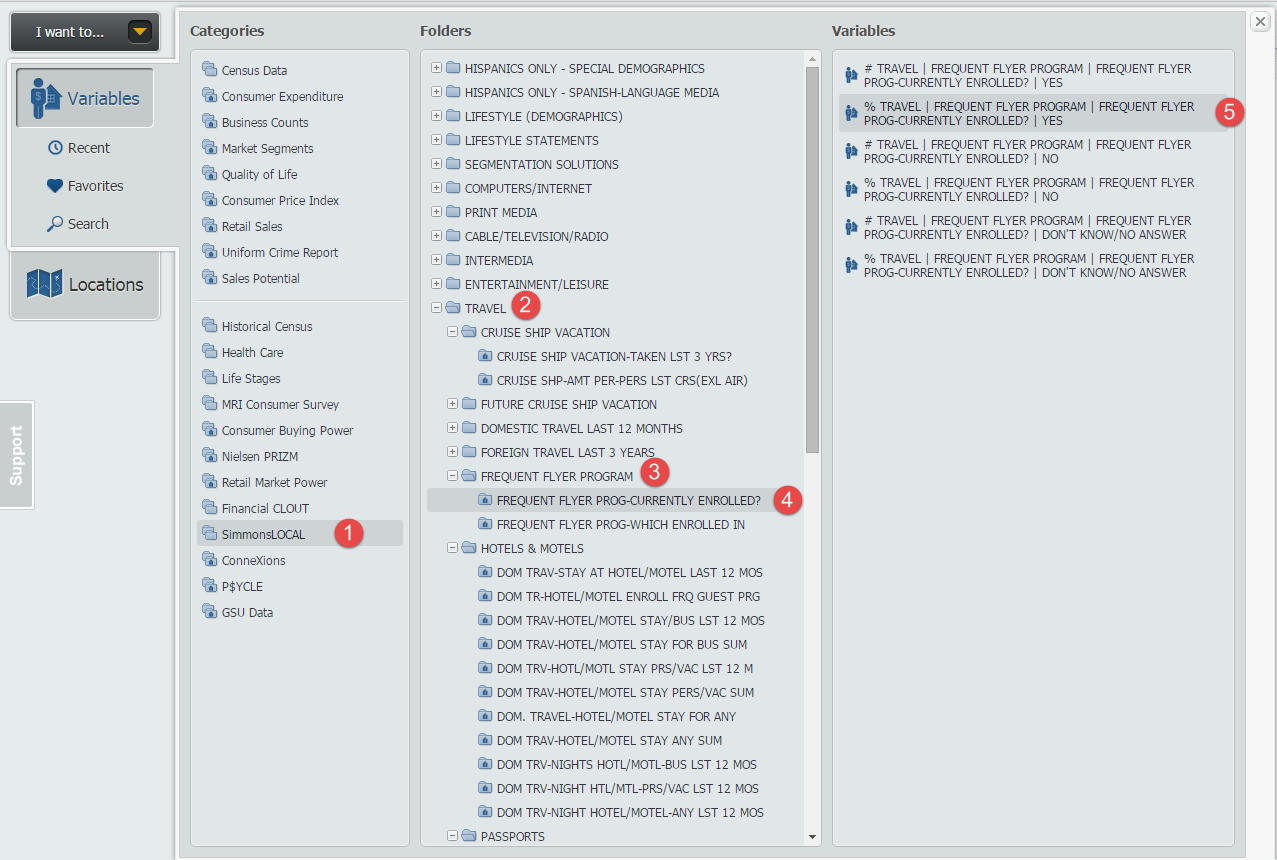
With over 50,000 variables in the data package, you can imagine the variety of variables available to you - in this example we’ll take a look specifically at survey takers who said YES to being currently enrolled in a frequent flyer program. In total, there is 24 variables related to frequent flyer programs including airline specific programs from: Southwest Airlines, Delta, United, and Continental. Let’s get started!
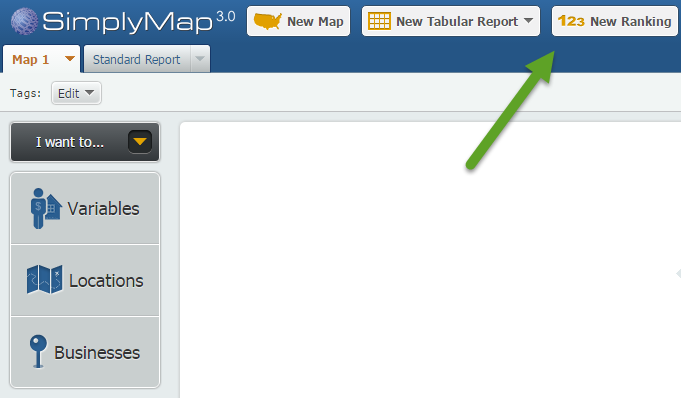
First, create a Ranking Report in SimplyMap.
Open the Variables tab and follow this path: SimmonsLOCAL » TRAVEL » FREQUENT FLYER PROGRAM » FREQUENT FLYER PROG-CURRENTLY ENROLLED?
Next, click on the Locations panel and use the USA as your geography. Once you close out the Locations panel, SimplyMap will generate your report. Use the Analyze Data By feature to analyze the USA by Cities.
Lastly, we applied a population filter to only show cities larger than 150,000 residents. Results below!
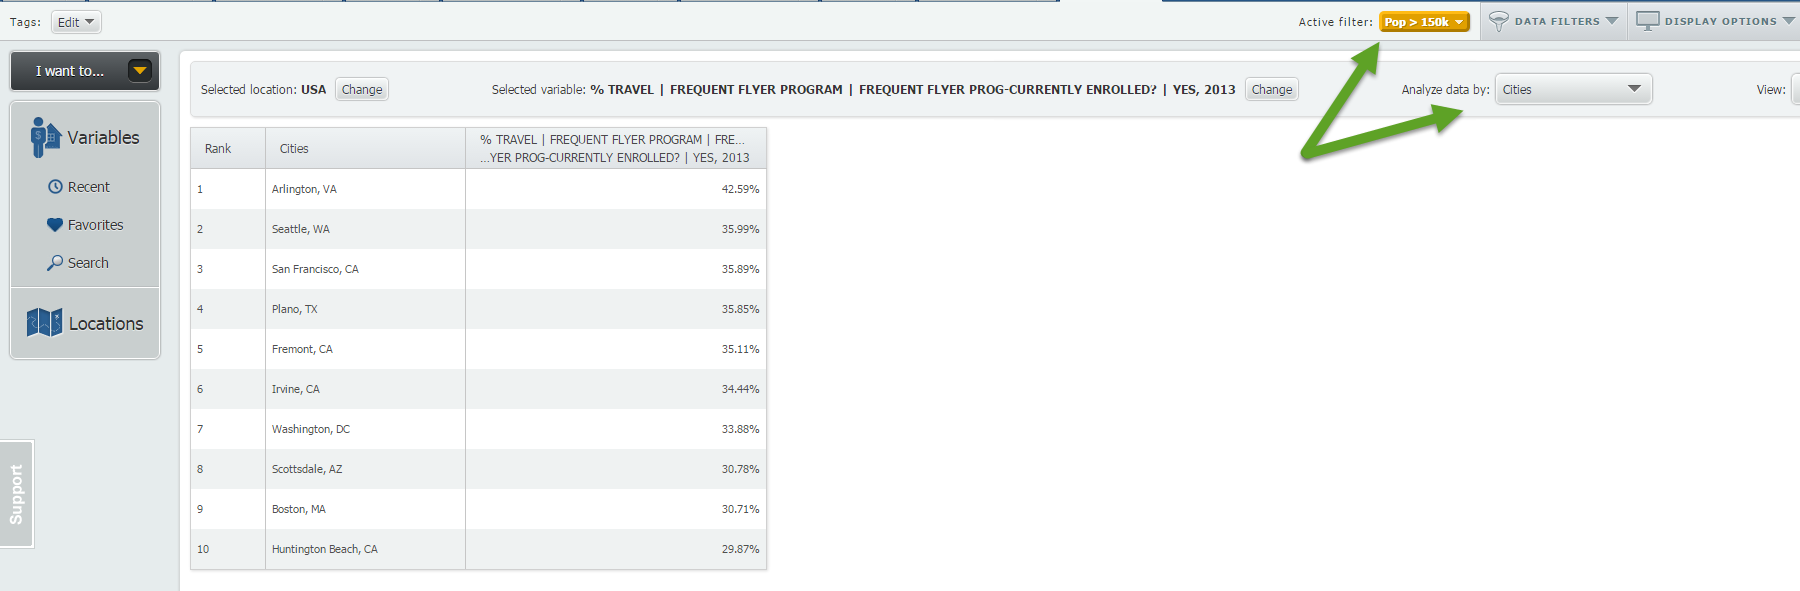
Arlington, VA comes away as the #1 spot in the United States for highest percentage of residents enrolled in a frequent flyer program. Seattle and San Francisco come in a distant 2nd and 3rd, respectively.
We hope you enjoyed this week’s SimplyMap report exploring data within the SimmonsLOCAL package. If your institution is interested in a free trial, send us an email to: support@geographicresearch.com
More from SimplyAnalytics
Posted on May 10, 2016 by Admin
One benefit of data and applications like SimplyMap is the ability to visualize information. In this week’s report, we’ll take a quick look at some branding preferences in contiguous Amer...
Posted on Apr 27, 2015 by Admin
In this week’s write up we want to share some quick tips and tricks that you might not yet know about in SimplyMap. TIP #1 Did you know that you can share your work? SimplyMap allows you ...
Posted on Feb 05, 2015 by Admin
In this week’s edition of exploring SimplyMap data, we take a look at America’s coffee drinkers. SimplyMap contains more than 100 coffee related variables, including consumer spending on ...
Posted on Nov 17, 2014 by Admin
Our recent series Exploring SimplyMap Data Reports has focused on creating ranking reports for unique variables. Accordingly, we thought it would be helpful to write a quick tip on how to...
Posted on Dec 19, 2016 by Admin
Stop by the Geographic Research booth [#T8] at the Ontario Library Association Super Conference to get a hands-on look at our latest and greatest SimplyMap offering. The conference will t...
Posted on Feb 21, 2018 by Admin
We are looking forward to sharing SimplyAnalytics with the public library community at the upcoming PLA 2018 Conference in Philadelphia, PA. Our team will be exhibiting in Booth #855. Vis...
Posted on Dec 30, 2009 by Admin
Skokie Public Library, in Skokie, IL has published a useful overview of SimplyMap on the Mike's Space blog on SkokieNet. The article is filled with examples of research questions that can...
Posted on Sep 20, 2011 by Admin
Men's Health magazine has once again published rankings that include research from SimplyMap. They ranked the most (and least) educated cities in America. In addition to several other sou...
Posted on Apr 23, 2018 by Admin
Hello everyone and welcome to this week’s blog. This week we will discuss how to create and utilize filters for your research. Why Use a Filter? Filters are a great way to identify target...
Posted on Mar 02, 2009 by Admin
ACRL's 14th National Conference will be held at the Washington State Trade and Convention Center in downtown Seattle, March 12-15, 2009. Every other year, ACRL offers its premier profe...