


Browsing for Data Variables: Category Search
Posted on Oct 26, 2018 by Admin
Welcome readers! This week we’ll take a look at how to browse for data by category in SimplyAnalytics. Browsing by Category is the default way of browsing for data in SimplyAnalytics. It includes robust filtering capabilities to quickly find the specific data you are looking for from among the thousands of variables in the database.
Suppose we want to find the percentage of females who are employed in the healthcare industry.
First, select the broadest appropriate category - Jobs & Employment.
The top left of the panel displays how many variables are related to Jobs & Employment.
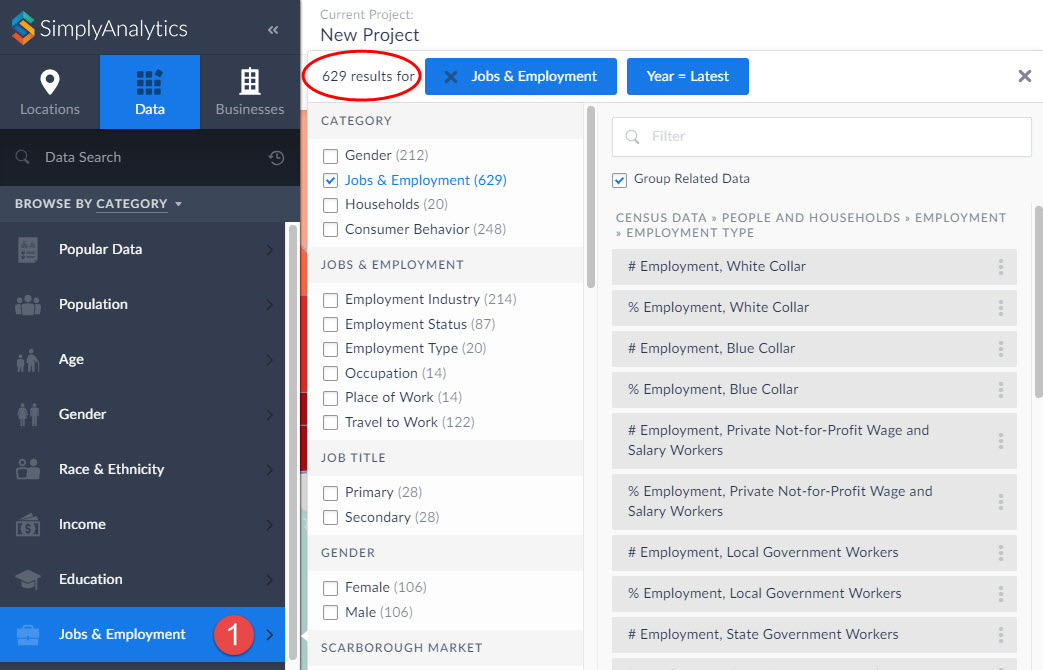
Notice in the image above you can search further within Jobs & Employment, and also specify a gender - scroll down to also choose a year, data type, and data set.
Click on the appropriate checkboxes to narrow down the options:
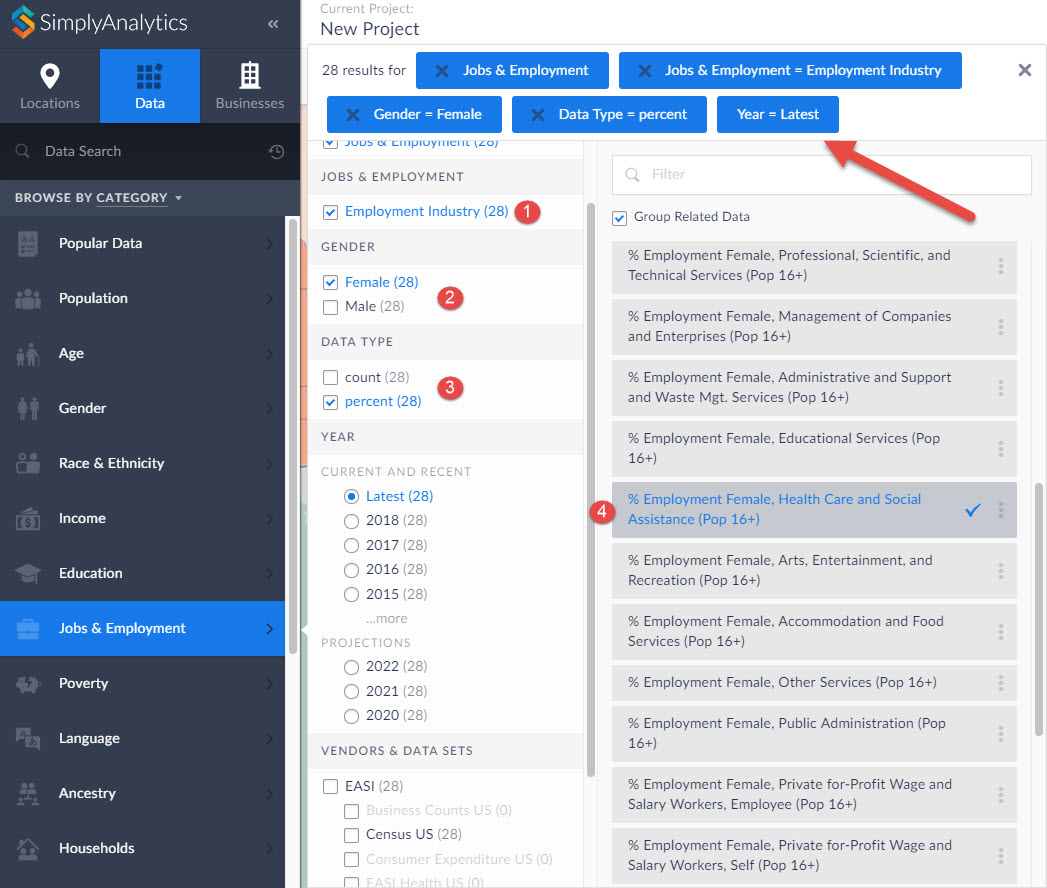
The list gets narrowed down to 28 results, and you can scroll down on the right-hand side to identify the target variable.
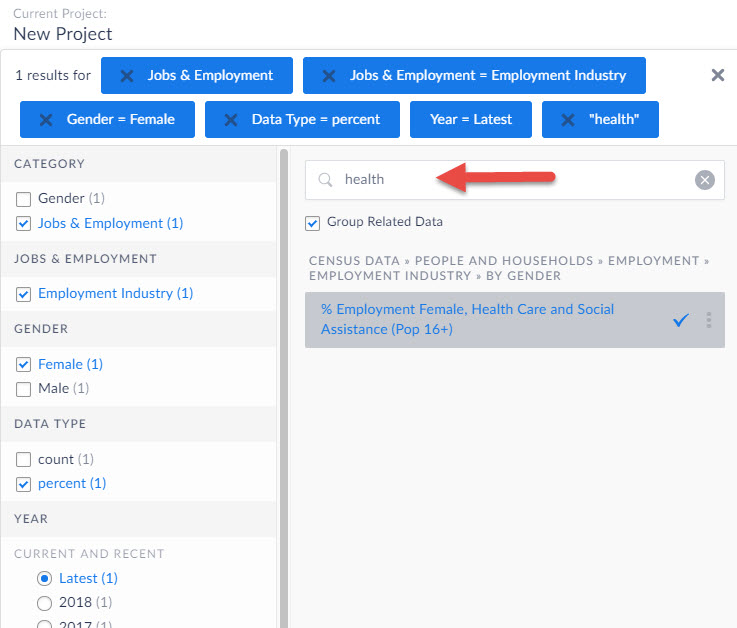
TIP: Notice the filter field within the panel - you can use this to quickly find specific data by entering a keyword in this field.
We hope you enjoyed this week’s write up - please let us know if there’s anything in particular you like to see in future posts!
More from SimplyAnalytics
Posted on Sep 05, 2019 by Admin
We are pleased to be exhibiting again at the Charleston Library Conference, on Tuesday November 5th, 2019. The Vendor Showcase will be held in the Gaillard Center Grand Ballroom (95 Calho...
Posted on Mar 04, 2020 by Admin
Come meet the SimplyAnalytics team at the 15th annual Electronic Resources and Libraries conference, held at the AT&T Hotel & Conference Center in Austin, TX. We will be exhibitin...
Posted on Nov 24, 2014 by Admin
In this week’s report, we research America’s most educated cities. SimplyMap contains a total of 111 educational attainment variables, including general population and by race. We used th...
Posted on May 24, 2023 by Admin
SimplyAnalytics is excited to attend. Swing by booth 1733 for a brief demo, and discover how our user-friendly demographics, business, health & marketing data analytics and visualizat...
Posted on Nov 06, 2014 by Admin
With over 75,000 variables in SimplyMap, you can find virtually any information you want. This week, we take a look at which U.S. locations spend the most money eating at restaurants or c...
Posted on Apr 05, 2019 by Admin
Come visit the SimplyAnalytics booth (325) at the upcoming ACRL 2019 show in Cleveland! Say hello, grab a chocolate, and stay for a quick demo of SimplyAnalytics. The team will be showcas...
Posted on Mar 04, 2014 by Admin
March 11-15 Indianapolis, Indiana The Public Library Association is prepared for another week of events, workshops and special appearances for librarians and authors. Visit our exh...
Posted on Sep 01, 2008 by Admin
The King County Library System in Washington State now subscribes to SimplyMap, and has published a brief review on their blog, Library Talk.
Posted on Jan 18, 2009 by Admin
Michigan State University is offering their users a basic introduction to using SimplyMap. The 1.5 hour session will cover the basics of how to use SimplyMap to create maps and reports u...
Posted on Jun 09, 2021 by Admin
Hello (virtual) ALA attendees! Thank you for dropping by our booth to learn more about SimplyAnalytics. Please email us if you have any questions or would like a live demo or free 30 day ...