


Reader Challenge - Can you guess what this map is portraying?
Posted on May 17, 2016 by Admin
This week’s SimplyMap report is a quick reader challenge. Can you guess what the map of the United States below is depicting?
Keep in mind the legend colors - lighter is less, and darker is more.
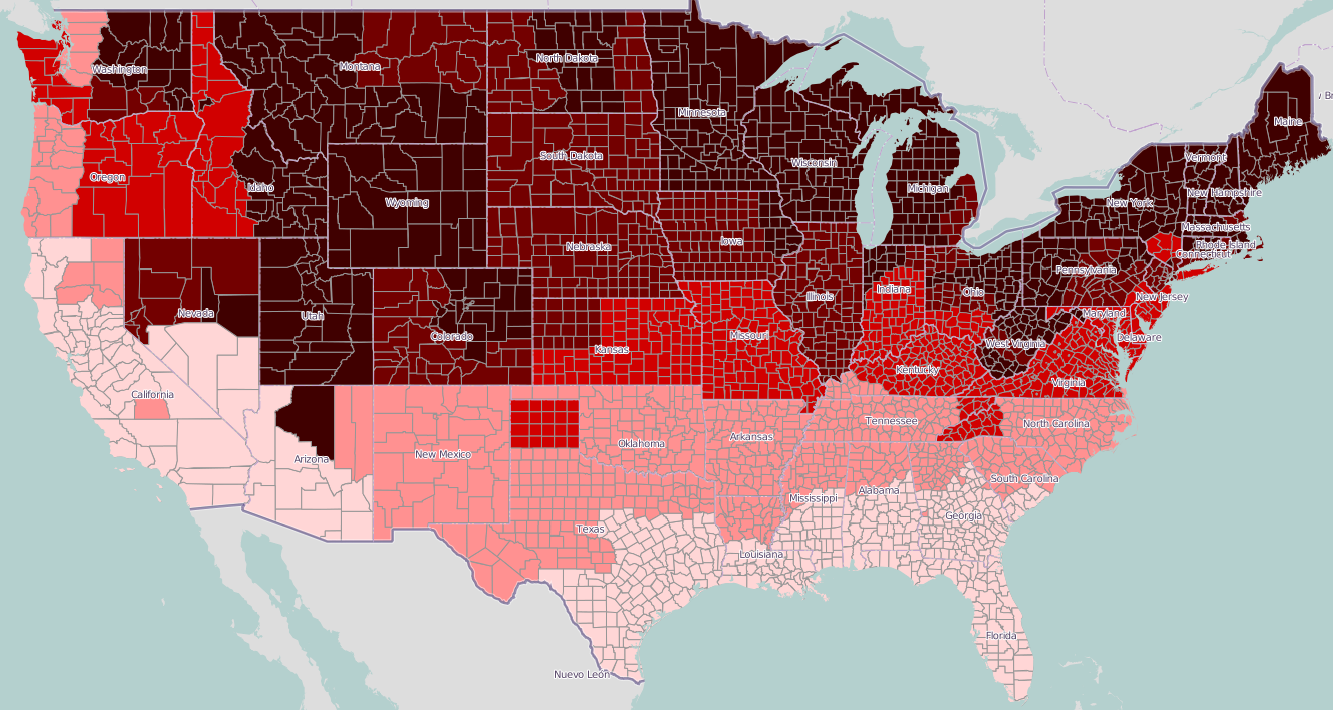
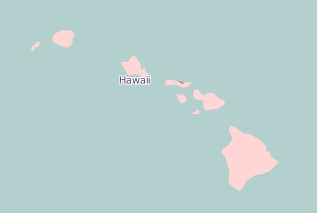
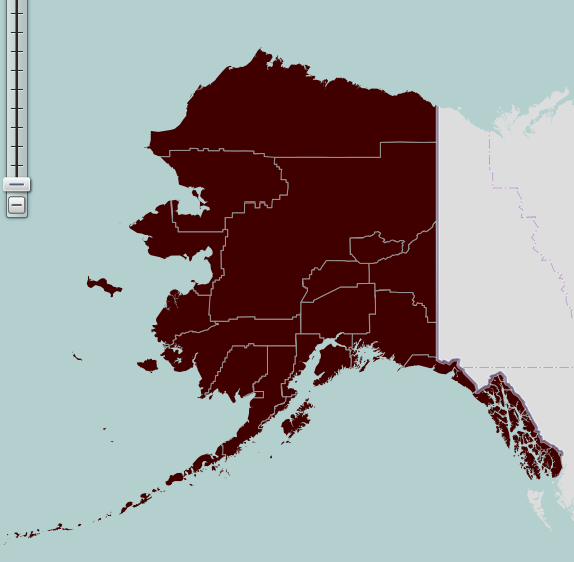
Hint: take a look at Alaska and Hawaii.
Find out the answer in next week’s SimplyMap report. Happy guessing!
More from SimplyAnalytics
Posted on Nov 06, 2014 by Admin
With over 75,000 variables in SimplyMap, you can find virtually any information you want. This week, we take a look at which U.S. locations spend the most money eating at restaurants or c...
Posted on Jul 28, 2013 by Admin
We recently discovered some interesting data on participation and attitudes towards recycling, and decided to dig a bit deeper into our Experian SimmonsLOCAL data. This data package inclu...
Posted on Oct 30, 2018 by Admin
We are pleased to be exhibiting at this year's 30th Annual Charleston Library Conference! The Charleston Vendor Showcase will be held Tuesday, November 6, 2018, from 10:30 a.m. to 6:00 p....
Posted on Dec 03, 2012 by Admin
Come visit the Geographic Research booth at the Ontario Library Association Super Conference this season. The conference will take place on January 30 - February 2, 2013 at the Metro Toro...
Posted on Feb 24, 2019 by Admin
We will be exhibiting at SCELC* Vendor Day on March 14th. Visit us at table 510 and attend one of our two sessions demonstrating SimplyAnalytics. The presentations will highlight newly av...
Posted on Jun 07, 2011 by Admin
We will be exhibiting at the Special Library Association Annual Conference in Philadelphia and the American Library Association conference in New Orleans later this month. Come and visit ...
Posted on Dec 16, 2015 by Admin
Visit the SimplyMap team at the ALA Midwinter Meeting 2016 in Boston. We will be at booth #1913 offering product demonstrations, tips & tricks, and of course Ghirardelli Chocolate! Ex...
Posted on Aug 02, 2016 by Admin
Did you know that you can use SimplyMap to identify which make and model of vehicle is most prevalent within any location in the United States? In this week’s SimplyMap report, we’ll take...
Posted on Dec 19, 2016 by Admin
Stop by the Geographic Research booth [#T8] at the Ontario Library Association Super Conference to get a hands-on look at our latest and greatest SimplyMap offering. The conference will t...
Posted on Mar 04, 2020 by Admin
Come meet the SimplyAnalytics team at the 15th annual Electronic Resources and Libraries conference, held at the AT&T Hotel & Conference Center in Austin, TX. We will be exhibitin...