


Variable Menu Improvements & More
Posted on Dec 07, 2021 by Admin
Hello readers! We hope you are enjoying the holiday season as much as we are. Today, we are happy to announce a couple of improvements to SimplyAnalytics designed to help you get your research done more efficiently. Let’s check it out!
Variable Menu Changes
This first of two changes to the variable menus is rooted in customer suggestions that revolved around the same sort of question, namely: is there a way to quickly add in additional years or the # or % version of this variable? As of this week, the answer to this question is yes!
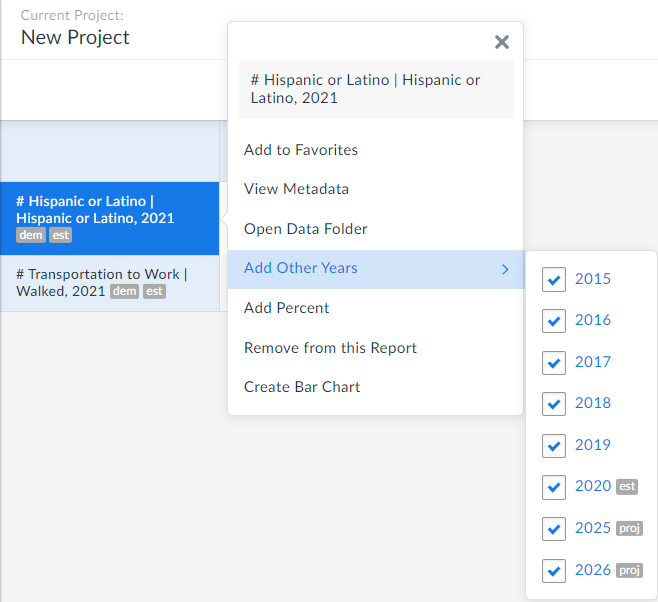
Now, when you are in a report and want to add in other years of data quickly, simply click on the variable name and refer to the Add Other Years text in the menu that displays.
In the example below, the chosen data variable is # Hispanic or Latino Population for the year 2021, but notice in the Add Other Years option, you are now welcome to instantly add in years from 2015, 2016, 2017, 2018, 2019, 2020, 2025 and 2026.
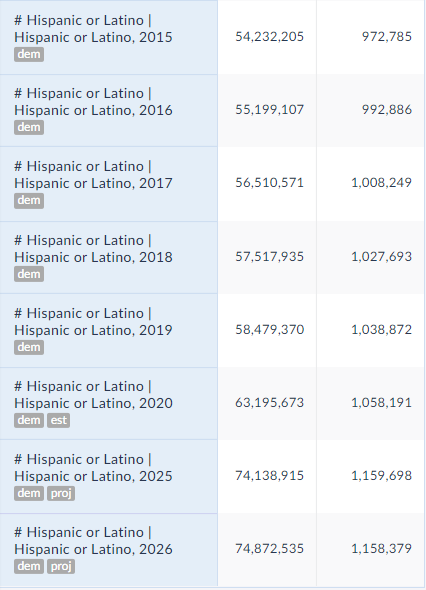
 All you need to do is select the desired year(s), close out the menu/click away and voila! The new years are automatically added to your report:
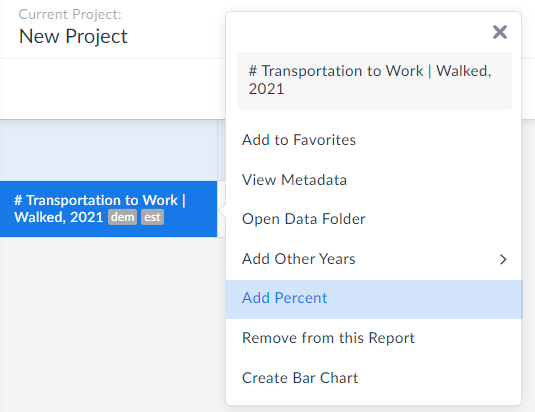
 Equally great is that users now have the ability to add in the other variation of your presently selected variable. For example, if you have # of adults walking to work in your report, you can immediately add in the % variation. This is also available from within the variable menu.
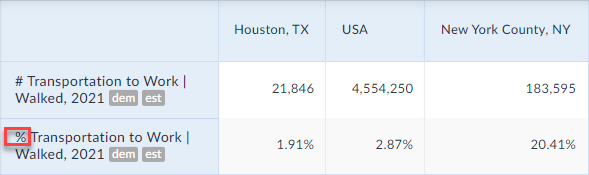
 The percent version is now added to your report:
 Create Data Table from Visualizations
We also wanted to update readers on this wonderful new feature that has flown under the radar, but is extremely useful.
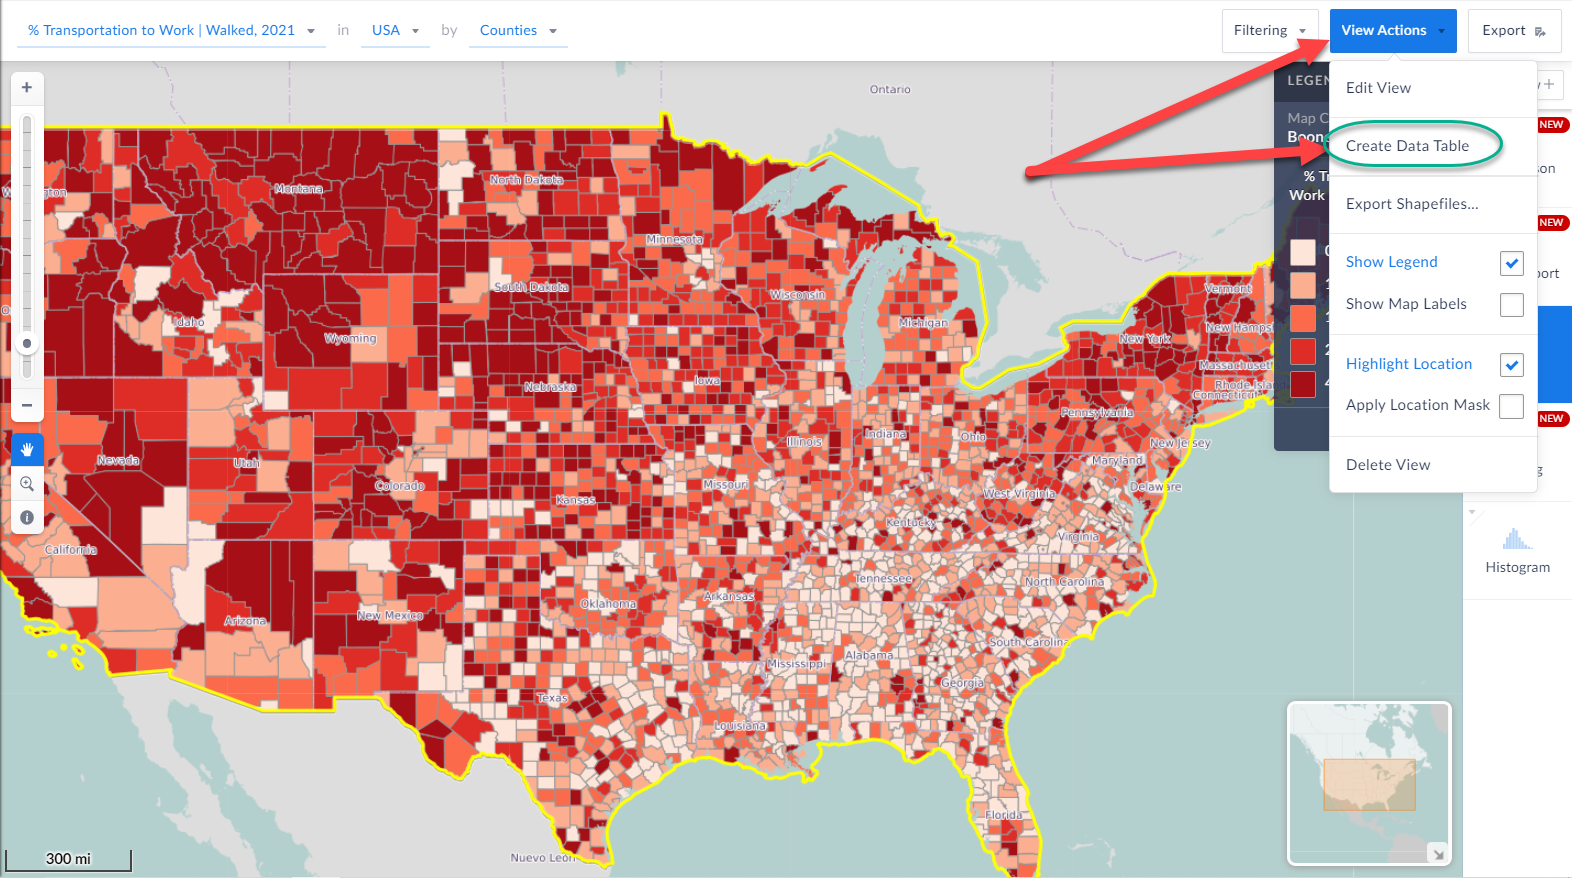
When you are in a visualization such as a map or histogram or bar chart, you are now able to instantly create a data table based on the underlying data of the visualization.
Check it out!
All you have to do is click on View Actions > Create Data Table and SimplyAnalytics will automatically generate a table for you. How cool is that?!
Create Data Table from Visualizations
We also wanted to update readers on this wonderful new feature that has flown under the radar, but is extremely useful.
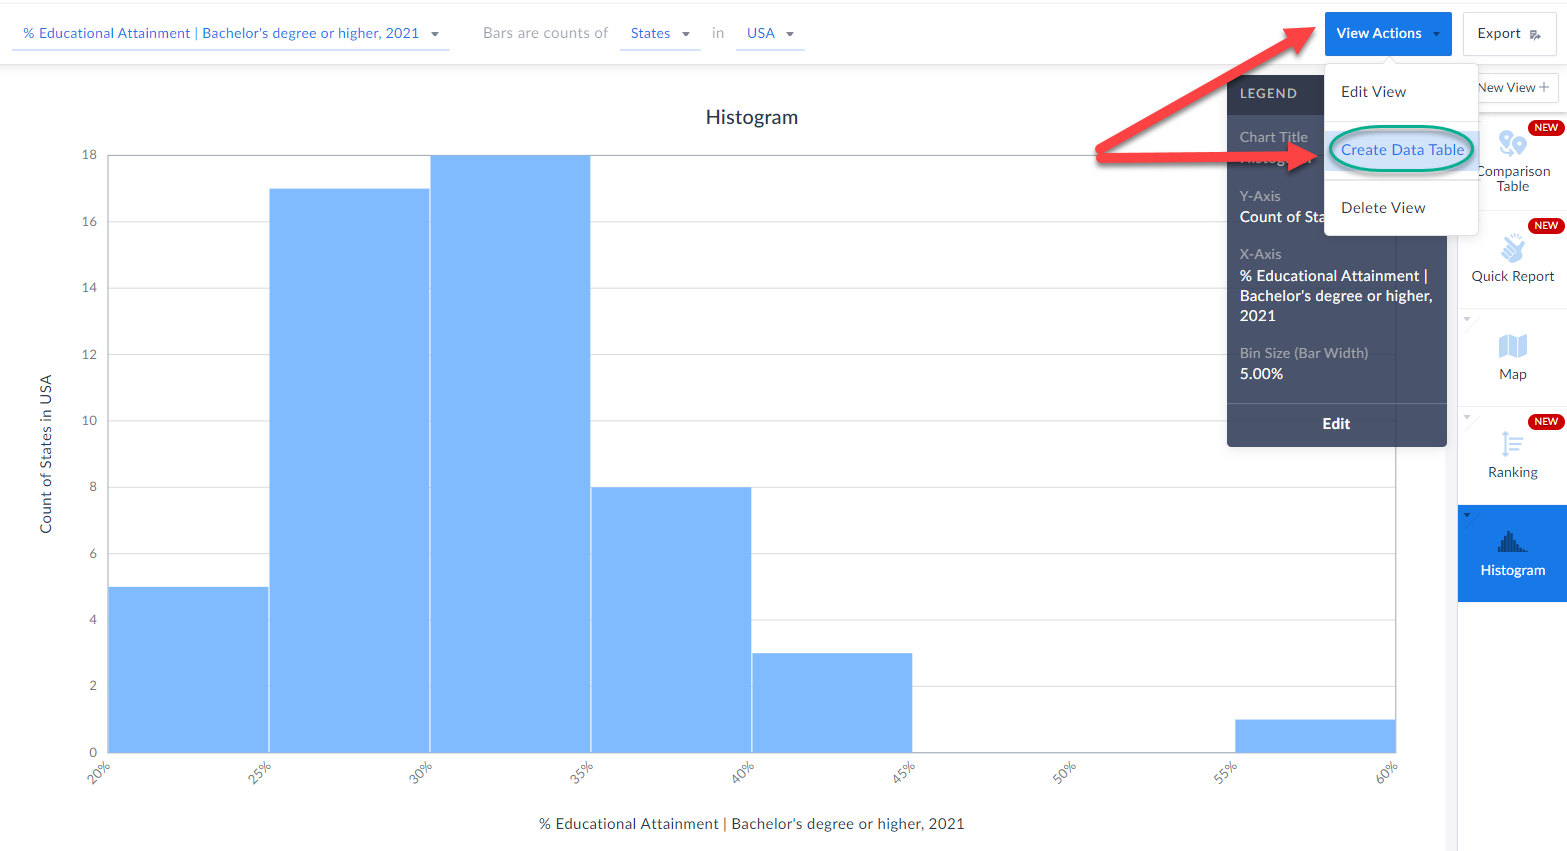
When you are in a visualization such as a map or histogram or bar chart, you are now able to instantly create a data table based on the underlying data of the visualization.
Check it out!
All you have to do is click on View Actions > Create Data Table and SimplyAnalytics will automatically generate a table for you. How cool is that?!
 We hope you enjoy these new enhancements to SimplyAnalytics - thank you as always for sending us these types of suggestions for improvements, we do listen!
Have a wonderful remainder of 2021, and as always please feel free to email us at anytime at: support@simplyanalytics.com
We hope you enjoy these new enhancements to SimplyAnalytics - thank you as always for sending us these types of suggestions for improvements, we do listen!
Have a wonderful remainder of 2021, and as always please feel free to email us at anytime at: support@simplyanalytics.com
All you need to do is select the desired year(s), close out the menu/click away and voila! The new years are automatically added to your report:
Equally great is that users now have the ability to add in the other variation of your presently selected variable. For example, if you have # of adults walking to work in your report, you can immediately add in the % variation. This is also available from within the variable menu.
The percent version is now added to your report:
Create Data Table from Visualizations
We also wanted to update readers on this wonderful new feature that has flown under the radar, but is extremely useful.
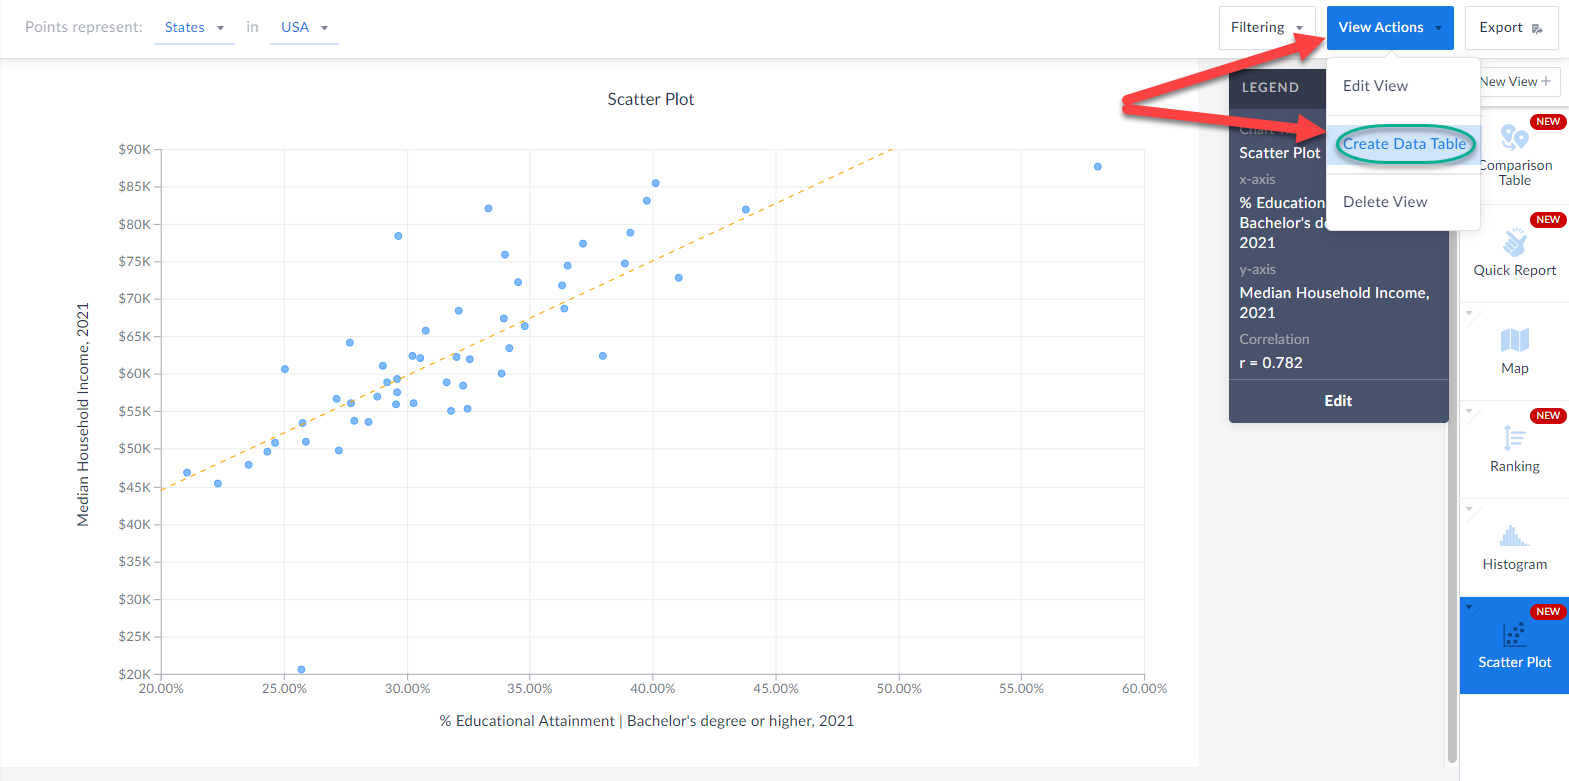
When you are in a visualization such as a map or histogram or bar chart, you are now able to instantly create a data table based on the underlying data of the visualization.
Check it out!
All you have to do is click on View Actions > Create Data Table and SimplyAnalytics will automatically generate a table for you. How cool is that?!
We hope you enjoy these new enhancements to SimplyAnalytics - thank you as always for sending us these types of suggestions for improvements, we do listen!
Have a wonderful remainder of 2021, and as always please feel free to email us at anytime at: support@simplyanalytics.com
More from SimplyAnalytics
Posted on May 26, 2020 by Admin
Hello readers! We hope you are doing well, and thank you for your continued support of SimplyAnalytics. We are excited to announce that scatterplots are officially live! Scatter plots ar...
Posted on Mar 10, 2011 by Admin
The GRI team is looking forward to exhibiting at ACRL 2011 at the PA Convention Center in Philadelphia, March 30 - April 1, 2011. Every other year, ACRL offers its premier professional d...
Posted on May 25, 2010 by Admin
The American Library Association 2010 Annual Conference is coming and the GRI team is gearing up for another great event this summer. We will be in Washington, D.C. again this year, June ...
Posted on Mar 21, 2011 by Admin
Men's Health magazine decided to crown one town America's Most Socially Networked City, and has generated quite a buzz in the process. Their survey examined the number of Facebook and Li...
Posted on Jun 25, 2015 by Admin
In this week’s SimplyMap report, we review the different options available when searching for a business. The easiest and fastest method of mapping businesses or creating a business repor...
Posted on May 28, 2009 by Admin
The Charleston Advisor, which publishes critical reviews of online resources for libraries, published a review of SimplyMap in April. We are very pleased to have received 4 1/4 stars out...
Posted on Jun 02, 2017 by Admin
We can't wait for ALA Annual this Summer, and the opportunity to share SimplyAnalytics with the ALA community. Stop by the SimplyAnalytics booth (1339) and take a peak at what we've been ...
Posted on Apr 05, 2019 by Admin
Come visit the SimplyAnalytics booth (325) at the upcoming ACRL 2019 show in Cleveland! Say hello, grab a chocolate, and stay for a quick demo of SimplyAnalytics. The team will be showcas...
Posted on Jul 20, 2020 by Admin
Hello readers! We hope you are doing well and staying safe. Today we are excited to introduce the Simmons NCS crosstabs functionality! This is a feature we’ve been working on for a while,...
Posted on Nov 19, 2019 by Admin
Hello readers! Today we are bringing you a new blog entry inspired by a recent Help Desk question. If you ever have any questions about SimplyAnalytics, please do not hesitate to reach ou...