


From the Help Desk - Analyzing all States at Once
Posted on Oct 08, 2019 by Admin
Hello readers! This week’s “From the Help Desk” is short & sweet. Let’s get to it!
Question: How do I analyze all of the states at once in a report?
Answer: The Ranking Report allows you to analyze all of the smaller geographic units in one larger area. For example, all the states in the USA, all of the Census Tracts in a County, etc.
Ranking Reports are a default view in your project, so there are only a few steps required.
1. Open the Ranking Report from the list of Views on the right side of the SimplyAnalytics window
2. In your Ranking Report, set the location to be: USA
3. Set the appropriate dropdown to be: States
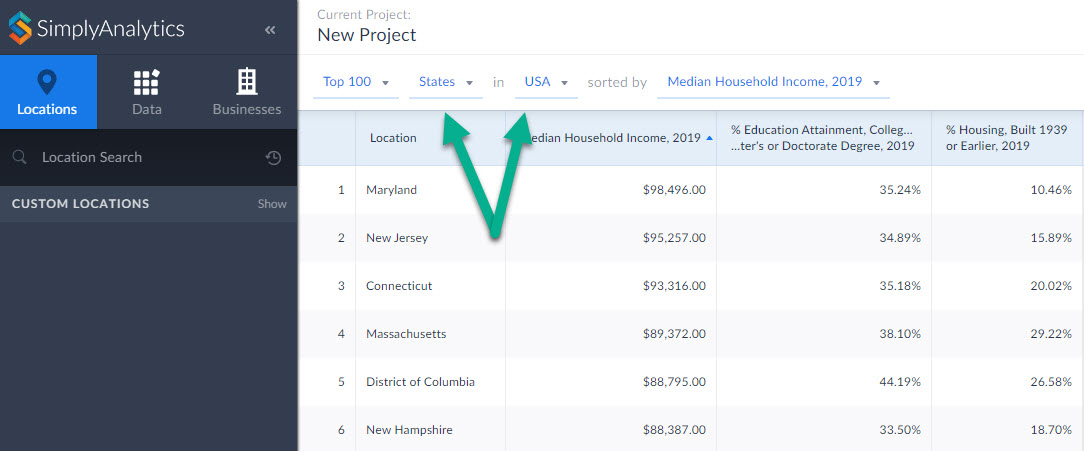
Your report will compile showing all the states in the USA. From there you are welcome to add in any variables of your choosing by selecting them from the list of recently used variables at the top of the report, or browsing the Data panel for additional variables.
That’s it for today! Stay tuned for more, and as always please do not hesitate to reach out to us with your questions to: support@simplyanalytics.com
More from SimplyAnalytics
Posted on May 23, 2012 by Admin
We will be exhibiting at the Special Libraries Association (SLA) annual conference and Info-Expo at McCormick Place in Chicago Sunday June 15th - Tuesday July 17th. Visit us at Booth 124 ...
Posted on Jan 23, 2024 by Admin
We are excited to again make the trip to Los Angeles for SCELCapalooza 2024 hosted at Loyola Marymount University! Please drop by our table on Wednesday, Feb. 28th to learn more about Sim...
Posted on Sep 20, 2011 by Admin
Men's Health magazine has once again published rankings that include research from SimplyMap. They ranked the most (and least) educated cities in America. In addition to several other sou...
Posted on Jul 09, 2015 by Admin
In this week’s SimplyMap report, we set out to find which cities have the highest percentages of people who use their bike as their mode of transportation to work in the US. Let’s get sta...
Posted on Sep 05, 2019 by Admin
SimplyAnalytics will be exhibiting at the biennial North Carolina Library Association conference, to be held this year at the Winston-Salem Benton Convention Center. If you are attending,...
Posted on Dec 06, 2009 by Admin
ALA's Choice Magazine, publisher of independent reviews of products and services for academic libraries, released a new review of SimplyMap in the December 2009 edition. The reviewer, Car...
Posted on Nov 29, 2009 by Admin
The ALA 2010 Midwinter Meeting will be held on January 15-19, 2010 at the Boston Convention and Exhibition Center. (Note that this is not the Hynes Convention Center). Geographic Research...
Posted on Feb 02, 2024 by Admin
We are excited to be back exhibiting at PLA this April in Columbus, OH. Join us at Booth #2631 to discover how SimplyAnalytics can help libraries understand their service area, assist sma...
Posted on Apr 17, 2018 by Admin
The SimplyAnalytics team would like to congratulate Rachel Holder, MLS candidate at Indiana University for being selected as this year's recipient of the BRASS Student Travel Award! ...
Posted on Feb 20, 2018 by Admin
We are looking forward to attending the annual SCELC (Statewide California Electronic Library Consortium) Vendor day, at Loyola Marymount University in Los Angeles on March 8th. In additi...